Arch Iran Med. 26(6):290-299.
doi: 10.34172/aim.2023.45
Original Article
Appropriateness of Intensive Statin Treatment in People with Type Two Diabetes and Mild Hypercholesterolemia: A Randomized Clinical Trial
Mohammad Taghi Gorji Conceptualization, Investigation, Project administration, 1 
Fariba Alaei-Shahmiri Data curation, Formal analysis, 1
Gisoo Darban Hosseini Amirkhiz Investigation, Methodology, Visualization, Writing – original draft, 2
Seyed Hashem Sezavar Conceptualization, Methodology, 2
Mojtaba Malek Conceptualization, Supervision, Validation, Writing – review & editing, 2, *
Mohammad E Khamseh Supervision, Validation, Writing – review & editing, 1
Author information:
1Endocrine Research Center, Institute of Endocrinology and Metabolism, Iran University of Medical Sciences (IUMS), Tehran, Iran
2Research Center for Prevention of Cardiovascular Disease, Institute of Endocrinology and Metabolism, Iran University of Medical Sciences (IUMS), Tehran, Iran
Abstract
Background:
The aim of this study was to compare moderate- versus high-intensity statin therapy in patients with type 2 diabetes and low-density lipoprotein (LDL) cholesterol less than 130 mg/dL.
Methods:
This was a randomized, open-label, parallel design trial comprised of 79 patients randomly allocated into two groups receiving high-intensity [atorvastatin 40 mg (A40) or rosuvastatin 20 mg (R20) daily] or moderate-intensity [atorvastatin 20 mg (A20) or rosuvastatin 10 (R10) mg daily] statins for eight weeks. The variables investigated were lipid profile, high sensitivity C-reactive protein (hs-CRP), and interleukin-6 (IL-6).
Results:
The percentage of decrease in LDL levels (±SD) for the high-intensity group (-35.5±25.5) was significantly greater than the moderate-intensity group (-24.6±23.5) (P=0.04). While 38.1% (n:8) of patients receiving A20 and 55% (n:11) of those being on R10 achieved the targets of≥30% reduction in the LDL level, these figures were 63.2% (n=12) and 73.8% (n=14) for A40 and R20 subgroups, respectively. Subsequently, the likelihood of achieving LDL reduction≥30%, was significantly greater with high-intensity statin therapy (OR: 3.1, 95% CI: 1.09, 8.90, P=0.03). Logistic regression analysis also showed that for every 1 mg/dL increase in the baseline LDL level, the odds of achieving the LDL reduction≥30% increased by 1.04 times [95% CI: (1.01, 1.07), P=0.003].
Conclusion:
Despite the general conception, moderate-intensity statins are not adequate for the majority of patients with T2DM and mild hyperlipidemia and greater numbers of patients could reach the LDL cholesterol target with high-intensity statin therapy.
Keywords: High-intensity statin, Hyperlipidemia, LDL, Moderate-intensity statin, Type 2 diabetes
Copyright and License Information
© 2023 The Author(s).
This is an open-access article distributed under the terms of the Creative Commons Attribution License (
https://creativecommons.org/licenses/by/4.0), which permits unrestricted use, distribution, and reproduction in any medium, provided the original work is properly cited.
Cite this article as: Gorji MT, Alaei-Shahmiri F, Darban Hosseini Amirkhiz G, Sezavar SH, Malek M, Khamseh ME. Appropriateness of intensive statin treatment in people with type two diabetes and mild hypercholesterolemia: a randomized clinical trial. Arch Iran Med. 2023;26(6):290-299. doi: 10.34172/aim.2023.42
Introduction
Atherosclerosis remains the leading cause of mortality in human beings.1 Dyslipidemia has an important role in the development of the atherosclerotic disease.2 The prevalence of dyslipidemia is greater among patients with type 2 diabetes mellitus (T2DM).3 A high level of low-density lipoprotein (LDL) cholesterol is one of the most important risk factors for cardiovascular problems.4 Statins are considered as the first-line medical treatment for prevention of atherosclerotic cardiovascular disease (ASCVD). The intensity of statin therapy depends on age, duration of DM, LDL level, clinical presentations, and ASCVD risk. The aim of moderate-intensity statin therapy is 30%-50% and high-intensity 50% or more reduction in LDL level. Although both treatments can decrease the risk of ASCVD, the greater the LDL reduction, the lower the risk.5
According to the baseline features, different intensity of statin treatment is necessary to treat LDL cholesterol to the target.6 The strategy used to prevent over- or under- treatment is titration,7 which, although an effective and accurate method, is costly and time-consuming. It has been reported that a large number of patients do not achieve the therapeutic goals.8,9 Under-treatment may not reduce the ASCVD risk to the optimum. On the other hand, over-treatment raises the costs and increases the risk of side effects such as myopathy, liver dysfunction, and elevated risk of diabetes, which are dose-dependent.10
In this study, we aimed to survey the effects of different intensity statin therapies on LDL level in patients with T2DM and mild hyperlipidemia.
Materials and Methods
Subjects
The study consisted of patients aged 40 to 75 years with T2DM and mild hyperlipidemia who did not have ASCVD and were recommended to take moderate-intensity statin therapy for primary prevention according to the ADA 2018 guideline7 and had medical record at the Institute of Endocrinology and Metabolism, Iran University of Medical Sciences (IUMS). Pregnant or lactating women, patients already on lipid-lowering agents (statins, bile acid binding resins, cholesterol absorption inhibitor, fibrates, niacin, omega-3 fatty acids), those with genetic disorders, renal failure, rheumatic diseases, untreated thyroid disorders, biliary or liver diseases, as well as individuals with elevated levels of serum alanine aminotransferase (ALT > 3 ULN) or creatine phosphokinase (CPK > 10 ULN), patients on corticosteroids, cyclosporins or hormone replacement therapy, history of alcohol use, acute and chronic infectious or inflammatory disease were excluded from the study.
Study Design and Procedure
This study was a randomized, open-label, parallel design trial carried out between November 2019 and July 2020. Eligible patients were randomly assigned to the study groups receiving high-intensity (atorvastatin 40 mg or rosuvastatin 20 mg daily) or moderate-intensity (atorvastatin 20 mg or rosuvastatin 10 mg daily) statins for eight weeks by performing block randomization with a block size of 4.
The primary objective was to compare the effects of moderate- and high-intensity statin therapies on LDL cholesterol. The secondary objective included the effects of intensity of treatment on high-sensitivity C-reactive protein (hs-CRP) and interleukin-6 (IL-6).
This study was reviewed and approved in two subsets by Iran University of Medical Science’s Institutional Review Board and was registered in the clinical trials database. The research protocol is available online (https://www.irct.ir; identifier: IRCT20180929041169N1; date: 07/01/2019 and identifier: IRCT20180929041169N2; date: 10/01/2019). The study was conducted according to the Declaration of Helsinki and was approved by the ethics committee of Iran University of Medical Sciences (Approval number IR.IUMS.FMD.REC.1398.375). Informed consent was obtained from all participants prior to enrollment. The Abidi Pharmaceuticals had supplied the medications (atorvastatin and rosuvastatin). This study follows the recommendations proposed by the CONSORT Statement.
Clinical Measurements
Demographic, social and medical history of participants, including history of smoking, hypertension, other diseases and drug consumption were obtained. The patients’ weight and height were measured and body mass index (BMI) was calculated as follows: BMI = weight (kg)/[height(m)]2. The systolic blood pressure (SBP) and diastolic blood pressure (DBP) were measured by an experienced nurse using a manual brachial sphygmomanometer with patients in a sitting position, after five minutes of rest while their arm was positioned at their heart level. The average of three measurements was reported. Patients on antihypertensive treatment and those with SBP ≥ 140 mm Hg or DBP ≥ 90 mm Hg were considered as having hypertension (HTN). Diabetes was diagnosed based on the American Diabetes Association’s guidelines or previous history of diabetes. Individuals with a history of at least 100 cigarettes in their lifetime and currently smoking were considered as current smokers.
Laboratory Examination
Blood samples were collected after an overnight fasting of at least 8 hours. Fasting blood glucose (FBS), triglyceride (TG), total cholesterol, high-density lipoprotein (HDL), LDL, aspartate transaminase (AST), ALT, and CPK were measured by standard enzymatic method with Pars Azmun diagnostic kits (Pars Azmun Co., Tehran, Iran). The intra- and inter-assay coefficients of variation were respectively 1.5 and 0.8 for FBS, 1.5 and 1.1 for TG, 0.7 and 1.3 for HDL, 0.6 and 1.3 for LDL, 3.1 and 1.4 for AST, 2.7 and 1.6 for ALT, and 1.5 and 1.1 for CPK. IL-6 and hs-CRPand were measured with the chemiluminescent immunometric method using an IMMULITE 2000 immunometric assay system (Siemens Healthcare GmbH, Erlangen, Germany).
Statistical Methods
The data were analyzed using IBM SPSS Statistics for Windows (Version 22.0 IBM Corp. Released 2013. Armonk, NY). Continuous variables are expressed as mean ± SD, or as median (IQR) for skewed data. Categorical variables are presented as n (% within group). Within-group comparisons were performed using a paired-samples t test or a Wilcoxon test for normally distributed and non-normal data, respectively. Variables of interest were compared between the treatment groups using χ2 test, analysis of variance (ANOVA), analysis of covariance (ANCOVA) or a non-parametric test, as appropriate. Moreover, the logistic regression models were fitted to evaluate the effects of treatments and other covariates on the dichotomous responder outcomes, including patients achieving the treatment goals of: ≥ 30% and ≥ 50% reduction in cholesterol, LDL-C and TG levels; ≥ 30% and ≥ 50% increase in HDL; and ≥ 25% reduction in inflammatory markers of hs-CRP and IL-6. We explored the impact of statin therapies on serum cholesterol and LDL based on the intensity of the treatments. In these analyses, participants were categorized into two groups: 1) those treated with the moderate-intensity atorvastatin (20 mg/d) or rosuvastatin (10 mg/d), and 2) participants who received the high-intensity statin treatments (40 mg/d atorvastatin or 20 mg/d rosuvastatin). All tests were 2-tailed, and P ≤ 0.05 was considered statistically significant.
Sample size was calculated based on a predicted 20% (30 mg/dL) reduction in serum LDL level after statin therapy, assuming a standard deviation of 30 mg/dL.11 Using a clinical trial formula,12 a sample of 72 participants (18/subgroup) could provide sufficient power (85%) to detect the expected changes at the 5% significance level. Ninety-nine patients were recruited to allow for drop out/non-compliance.
Results
Of the 99 patients starting the study, data of 79 participants (38 men and 41 women) with a mean ( ± SD) age of 55.7 ± 9.1 years who completed the study were used for final analysis (Figure 1). As presented in Table 1, the four treatment groups were comparable in terms of age, gender and clinical characteristics at baseline (P values > 0.05).
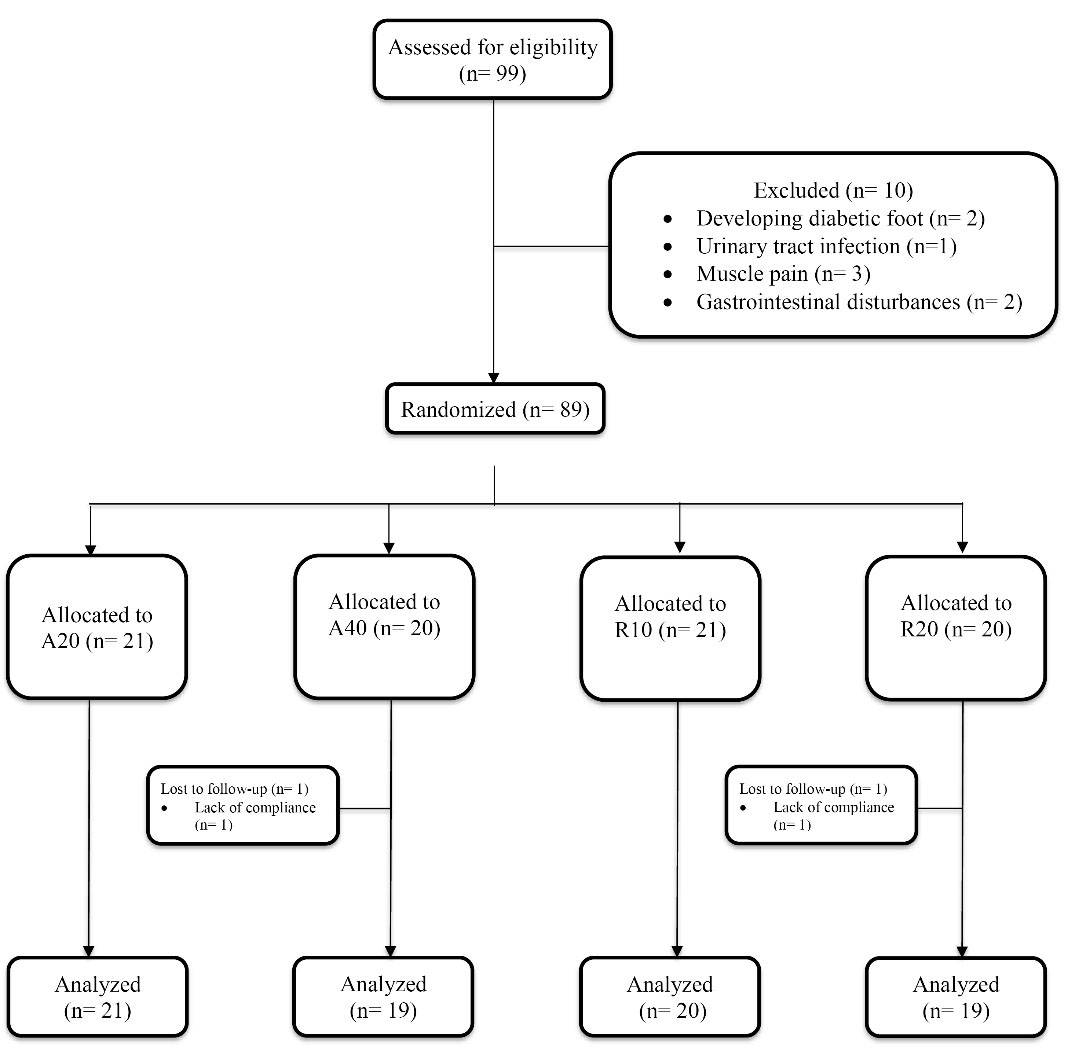
Figure 1.
Consolidated Standards of Reporting Trials (CONSORT) Diagram for Patient Enrolment, Follow-up, and Analysis of the Treatment Outcome. A20, atorvastatin 20 mg/d; A40, atorvastatin 40 mg/d; R10, rosuvastatin 10 mg/d; R20, rosuvastatin 20 mg/d
.
Consolidated Standards of Reporting Trials (CONSORT) Diagram for Patient Enrolment, Follow-up, and Analysis of the Treatment Outcome. A20, atorvastatin 20 mg/d; A40, atorvastatin 40 mg/d; R10, rosuvastatin 10 mg/d; R20, rosuvastatin 20 mg/d
Table 1.
Baseline Characteristics of the Participants.
|
Variables
|
Atorvastatin 20 mg (n=21)
|
Atorvastatin 40 mg (n=19)
|
Rosuvastatin 10 mg (n=20)
|
Rosuvastatin 20 mg (n=19)
|
P Value
|
| Age (y) |
56.0 ± 9.5 |
56.6 ± 8.7 |
55.2 ± 10.1 |
53.6 ± 7.2 |
0.73 |
| Female (%) |
11 (52.4%) |
10 (52.6%) |
11 (55.0%) |
9 (47.4%) |
0.971 |
| BMI (kg/m2) |
26 (24, 28) |
28 (25, 30) |
26 (24, 30) |
26 (24, 28) |
0.229 |
| HTN |
7 (33.3%) |
5 (26.3%) |
6 (30.0%) |
6 (31.6%) |
0.969 |
| SBP > 140 mm Hg |
3 (14.3%) |
1 (5.3%) |
1 (5%) |
2 (10.5%) |
0.681 |
| DBP > 90 mm Hg |
0 (0%) |
0 (0%) |
0 (0%) |
0 (0%) |
1.000 |
| Current Smokers (%) |
7 (33.3%) |
4 (21.1%) |
4 (20.0%) |
6 (31.6%) |
0.688 |
| Duration of DM (y) |
10 (6, 15) |
7 (3, 8) |
6.5 (4, 10.5) |
3 (3, 8) |
0.160 |
| Insulin Therapy (%) |
11 (52.4%) |
12 (63.2%) |
10 (50.0%) |
6 (31.6%) |
0.269 |
| FBS (mg/dL) |
124 (112, 145) |
152 (120, 185) |
132 (97, 187) |
130 (99, 187) |
0.309 |
| TG (mg/dL) |
153 (102, 176) |
135 (111, 172) |
120 (65, 165) |
102 (84, 155) |
0.592 |
| Cholesterol (mg/dL) |
160 (132, 198) |
164 (140, 200) |
169 (149, 178) |
163 (154, 196) |
0.650 |
| LDL (mg/dL) |
93.86 ± 28.65 |
93.21 ± 26.78 |
92.75 ± 25.87 |
94.06 ± 20.76 |
0.999 |
| HDL (mg/dL) |
43.1 ± 10.0 |
42.6 ± 10.6 |
48.5 ± 12.2 |
45.7 ± 8.5 |
0.234 |
| Cr (mg/dL) |
1 (0.85, 1.1) |
0.9 (0.8, 1.1) |
1 (0.9, 1.2) |
1 (0.9, 1) |
0.200 |
| hs-CRP (mg/dL) |
3.2 (1.7, 5.6) |
4.0 (2.8, 4.9) |
2.3 (1.3, 5.4) |
2.1 (1.4, 4.6) |
0.361 |
| IL-6 (pg/mL) |
3.3 (2.1, 4.3) |
3.2 (2.3, 4.3) |
3.2 (2.3, 4.4) |
3.4 (2.4, 4.1) |
0.800 |
Continuous variables are expressed as mean ± SD or as median (IQR) for skewed data. Categorical variables are presented as n (% within group). Between-group comparisons were performed using χ2 test, ANOVA or a nonparametric test (Median test), as appropriate.
Effect of Statin Therapies on Serum lipids & Inflammatory Markers
Statin therapy for eight weeks decreased the mean ( ± SD) LDL levels of participants receiving moderate-intensity statins (from 93.32 ± 26.99 to 67.59 ± 24.09 mg/dL, P < 0.001) as well as those on high-intensity statins (from 93.62 ± 23.73 to 58.35 ± 22.50 mg/dL, P < 0.001). Although the decline in LDL levels was greater for the high-intensity group, the between-group difference was statistically borderline (P = 0.06) (Table 2). Also, the percentage of decrease in LDL levels ( ± SD) for the high-intensity group (-35.5 ± 25.5) was significantly greater than the moderate intensity statins (-24.6 ± 23.5) (P = 0.04; Figure 2). There were no significant differences in between-subgroup comparisons in terms of the LDL lowering effect (P = 0.17) (Table 3). Similarly, total cholesterol and non-HDL cholesterol levels measured after eight weeks were significantly lower than baseline in both groups and all four subgroups; however, no meaningful change was detected in HDL or TG levels within- or between- groups or subgroups (Tables 2 and 3).
Table 2.
Effects of Statin Therapy on Serum Lipids & Inflammatory Markers Stratified by Treatment Intensity
|
Markers
|
Moderate intensity (n=41)
|
High intensity (n=38)
|
Between- group comparison
|
|
Baseline
|
Week 8
|
Changes
|
P
|
Baseline
|
Week 8
|
Changes
|
P
|
Difference of the changes*
|
P
|
| LDL (mg/dL) |
93.32 ± 26.99 |
67.59 ± 24.09 |
-25.73 ± 25.29 |
< 0.001 |
93.62 ± 23.73 |
58.35 ± 22.50 |
-35.27 ± 27.06 |
< 0.001 |
9.35 (-0.23, 18.94) |
0.056 |
| Chol (mg/dL) |
166 (143.5,183.5) |
131 (108,160) |
-17 (-53, -1) |
< 0.001 |
163.5 (143.5,198.5) |
117.5 (102.25,157) |
-34.5 (-65, -17) |
< 0.001 |
8.42 (-5.92, 22.77) |
0.246 |
| TG (mg/dL) |
146 (91.5,172) |
119 (84.5,158.5) |
-6 (-51, 14) |
0.07 |
131 (89.75,167.5) |
118 (96,149.5) |
0 (-39, 19) |
0.35 |
-7 (-29, 15) |
0.444 |
| HDL (mg/dL) |
45.93 ± 11.23 |
47.20 ± 10.75 |
1.27 ± 8.68 |
0.355 |
44.24 ± 9.67 |
46.61 ± 9.51 |
2.37 ± 9.42 |
0.130 |
0.42 (-3.20, 4.04) |
0.818 |
| Non-HDL (mg/dL) |
119.34 ± 38.12 |
89.56 ± 34.77 |
-29.78 ± 35.94 |
< 0.001 |
126.82 ± 29.25 |
84.66 ± 39.06 |
-42.16 ± 36.23 |
< 0.001 |
8.83 (-5.81, 23.47) |
0.233 |
| IL-6 (pg/mL) |
3.30 (2.25,4.35) |
2.30 (2.05,2.85) |
-0.6 (-1.5, 0) |
< 0.001 |
3.25 (2.38,4.15) |
2.30 (2.08,2.60) |
-0.7 (-1.6, -0.1) |
< 0.001 |
0.1 (-0.3, 0.7) |
0.495 |
| hs-CRP (mg/L) |
2.60 (1.45,5.35) |
2.10 (1.3,3.45) |
-0.7 (-2, 0.5) |
0.024 |
3.65 (1.58,4.82) |
1.85 (0.98,4.38) |
-1 (-3.2, 0.7) |
0.021 |
0.2 (-0.9, 1.4) |
0.662 |
Continuous variables are expressed as mean ± SD or as median (IQR) for skewed data unless otherwise stated. Within-group comparisons were performed using a paired sample t-test or a Wilcoxon test for normally distributed and non-normal data, respectively. Between-group comparisons were performed using ANCOVA (adjusted for baseline values) or a nonparametric test (Mann-Whitney test), as appropriate. *Data are presented as mean or median (95% CI).
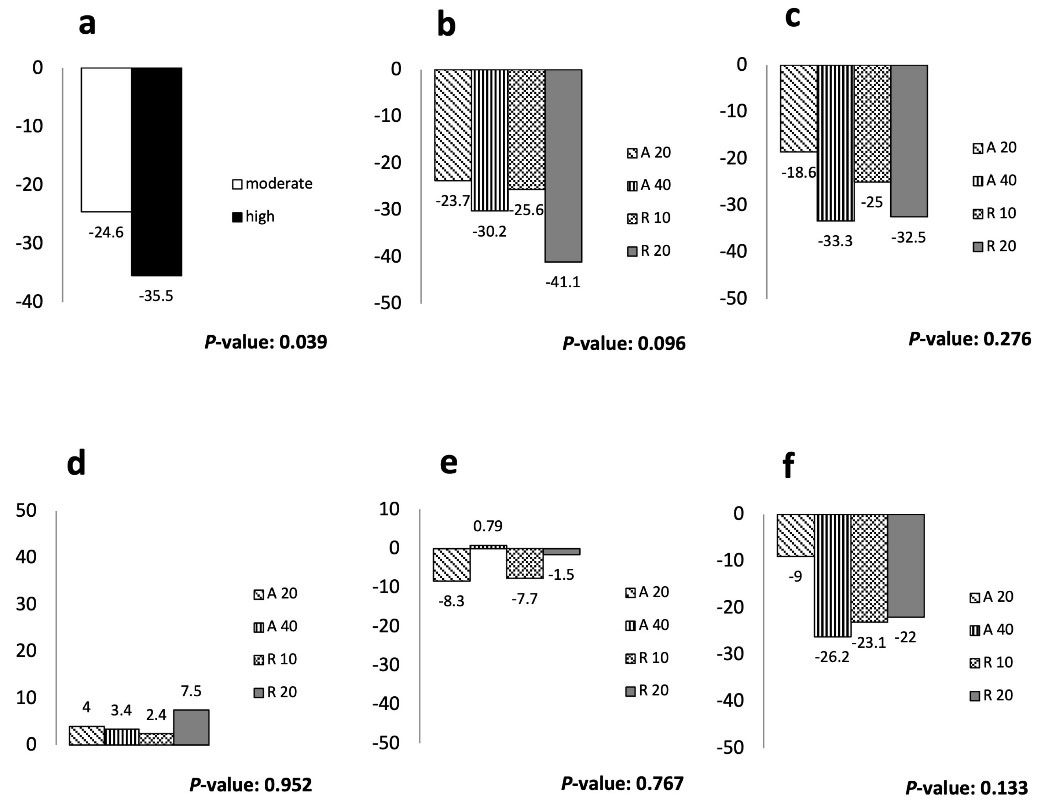
Figure 2.
Percentage of Change from the Baseline Value in Serum Lipids by the Treatment Group. (a) Mean change in LDL levels (%); (b) mean change in LDL levels (%); (c) mean change in non-HDL levels (%); (d) Mean changes in HDL levels (%); (e) median changes in TG levels (%); (f) median change in cholesterol levels (%). Between group comparisons were performed using ANOVA or non-parametric tests (median test), as appropriate. LDL, low-density lipoprotein cholesterol; HDL, high-density lipoprotein cholesterol; TG, triglyceride; A20, atorvastatin 20 mg/d; A40, atorvastatin 40 mg/d; R10, rosuvastatin 10 mg/d; R20, rosuvastatin 20 mg/d; low-dose, atorvastatin 20 mg and rosuvastatin 10 mg; high-dose, atorvastatin 40 mg and rosuvastatin 20 mg
.
Percentage of Change from the Baseline Value in Serum Lipids by the Treatment Group. (a) Mean change in LDL levels (%); (b) mean change in LDL levels (%); (c) mean change in non-HDL levels (%); (d) Mean changes in HDL levels (%); (e) median changes in TG levels (%); (f) median change in cholesterol levels (%). Between group comparisons were performed using ANOVA or non-parametric tests (median test), as appropriate. LDL, low-density lipoprotein cholesterol; HDL, high-density lipoprotein cholesterol; TG, triglyceride; A20, atorvastatin 20 mg/d; A40, atorvastatin 40 mg/d; R10, rosuvastatin 10 mg/d; R20, rosuvastatin 20 mg/d; low-dose, atorvastatin 20 mg and rosuvastatin 10 mg; high-dose, atorvastatin 40 mg and rosuvastatin 20 mg
Table 3.
Effects of Statin Therapy on Serum Lipids & Inflammatory Markers Stratified by Statin Types and Dosages.
|
Markers
|
Moderate-intensity
|
High-intensity
|
P
|
|
A20 Group (n=21)
|
R10 Group (n=20)
|
A40 Group (n=19)
|
R20 Group (n=19)
|
|
Baseline
|
Week 8
|
Baseline
|
Week 8
|
Baseline
|
Week 8
|
Baseline
|
Week 8
|
| LDL (mg/dL) |
93.9 ± 28.7 |
69.4 ± 29.0c |
92.8 ± 25.9 |
65.7 ± 18.2c |
93.2 ± 26.8 |
61.8 ± 23.2c |
94.1 ± 20.8 |
54.6 ± 21.7c |
0.17 |
| Chol. (mg/dL) |
160 (132,198) |
132 (113, 172)b |
169(149,178) |
129 (107, 149)b |
164(140,200) |
118 (103, 143)b |
163 (154,196) |
117 (100, 161)b |
0.30 |
| TG (mg/dL) |
153 (102,176) |
137 (98,160) |
118 (66,164) |
94 (77,130) |
135(111,172) |
127 (97,176) |
102 (84,155) |
118 (76,140) |
0.77 |
| HDL (mg/dL) |
43.2 ± 10.0 |
44.20 ± 9.3 |
48.8 ± 11.9 |
50.4 ± 11.5 |
42.7 ± 10.7 |
45.2 ± 10.0 |
45.8 ± 8.6 |
48.0 ± 9.1 |
0.69 |
| Non-HDL (mg/dL) |
123.1 ± 41.6 |
96.3 ± 36.3b |
115.5 ± 34.7 |
82.5 ± 32.5c |
127.4 ± 30.5 |
83.9 ± 37.7c |
126.2 ± 28.8 |
85.4 ± 41.4c |
0.50 |
| IL-6 (pg/mL) |
3.3(2.1,4.3) |
2.3(2.0,3.4) |
3.2(2.3,4.4) |
2.3(2.1,2.6)b |
3.2(2.3,4.3) |
2.3(2.1,2.6)b |
3.4(2.4,4.1) |
2.3(2.0,2.7)b |
0.65 |
| hs-CRP (mg/L) |
3.2 (1.7,5.6) |
2.1 (1.3,3.4) |
2.3(1.3,5.4) |
2.0(0.87,3.4) |
4 (2.8,4.9) |
1.8 (1,4.6)a |
2.1(1.4,4.6) |
1.9 (0.9,4.2) |
0.47 |
Continuous variables are expressed as mean ± SD or as median (IQR) for skewed data. Within-group comparisons were performed using a paired-samples t-test or a Wilcoxon test for normally distributed and non-normal data, respectively. Between-group comparisons were performed using ANCOVA (adjusted for baseline values) or a nonparametric test (Median test), as appropriate. aP < 0.05 compared to baseline; bP < 0.01 compared to baseline; cP < 0.00.
Eight-week statin therapy also resulted in significantly reduced level of hs-CRP in both moderate- and high-intensity groups (P = 0.024 and P= 0.021,respectively) without a significant difference between the groups. A similar effect was observed for IL-6 levels. The statin-induced changes in these inflammatory markers did not differ significantly across the four treatment subgroups (Table 2).
Effects of Statin Therapy on the Responder Outcomes
Responder outcomes for lipid profile were evaluated as the percentage of patients reaching the targets of ≥ 30% and ≥ 50% change in LDL, total cholesterol, TG, HDL, and non-HDL for each group. The proportion of patients achieving the targets of ≥ 30% decrease in the LDL level was 38.1% (8 patients) for the A20 subgroup, 55% (11 patients) for the R10, 63.2% (12 patients) for the A40, and 73.8% (14 patients) for the R20. These figures for the targets of ≥ 50% decline in LDL levels ranged between 19% and 42.1% for the A20 and R20 subgroups, respectively. Nineteen percent of patients in the A20 subgroup and 30% of the R10 subgroup as well as 42.1% of the A40 and R20 subgroups reached the target of ≥ 30% decrease in total cholesterol (Table 4). There was a significant difference between the proportions of participants in the high-intensity group who achieved the LDL goal of ≥ 30% and those in the moderate-intensity group (70.3% vs. 46.3%, P = 0.03), but the difference was non-significant for ≥ 50% LDL reduction (37.8% vs. 19.5%, P = 0.07). Moreover, a numerically greater proportion of patients treated with high-intensity statin achieved the specified cholesterol target of ≥ 30% reduction compared to those on moderate-intensity statin therapy (42.1% vs. 24.4%, P = 0.09).
Table 4.
Proportion of Patients Achieving the Lipids and Inflammatory Markers Targets Stratified by Treatment Intensity
|
Responder Outcomes
|
Moderate-intensity
|
High-intensity
|
|
A20 (n=21)
|
R10 (n=20)
|
A40 (n=19)
|
R20 (n=19)
|
| Patients achieving LDL targets, n (%) |
|
| ≥ 30% decrease |
8 (38.1%) |
11 (55.0%) |
12 (63.2%) |
14 (73.8%) |
| ≥ 50% decrease |
4 (19.0%) |
4 (20.0%) |
6 (31.6%) |
8 (42.1%) |
| Patients achieving chol targets, n (%) |
|
| ≥ 30% decrease |
4 (19.0%) |
6 (30.0%) |
8 (42.1%) |
8 (42.1%) |
| ≥ 50% decrease |
2 (9.5%) |
0 (0.0%) |
0 (0.0%) |
0 (0.0%) |
| Patients achieving TG targets, n (%) |
|
| ≥ 30% decrease |
5 (23.8%) |
5 (25.0%) |
4 (21.1 %) |
5 (26.3 %) |
| ≥ 50% decrease |
1 (4.8 %) |
4 (20.0 %) |
2 (10.5 %) |
1 (5.3 %) |
| Patients achieving HDL targets, n (%) |
|
| ≥ 30% decrease |
3 (14.3 %) |
2 (10.0 %) |
3 (15.8 %) |
2 (10.5 %) |
| ≥ 50% decrease |
0 (0%) |
0 (0%) |
1 (5.3 %) |
0 (0%) |
| Patients achieving non-HDL targets, n (%) |
|
| ≥ 30% decrease |
6 (28.6 %) |
12 (60.0 %) |
12 (63.2 %) |
11 (57.9 %) |
| ≥ 50% decrease |
3 (14.3 %) |
3 (15.0 %) |
5 (26.3 %) |
7 (36.8 %) |
| Patients achieving hs-CRP reduction of ≥ 25%, n (%) |
9 (42.9 %) |
10 (50.0 %) |
10 (52.6 %) |
10 (52.6 %) |
| Patients achieving IL-6 reduction of ≥ 25%, n (%) |
8 (38.1 %) |
9 (45.0 %) |
9 (47.4 %) |
9 (47.4 %) |
Responder outcomes for inflammatory markers were evaluated as percentage of patients reaching the target of ≥ 25% decrease in hs-CRP and IL-6 for each subgroup. The highest success rate pertained to the A40 and R20 subgroups with 52.6% of patients reaching the target for hs-CRP. The lowest success rate pertained to the A20 subgroup in which 38.1% of patients reached the target for IL-6 (Table 4).
Subsequent logistic regression analysis showed the administrated statin therapy as a significant determinant for achieving the LDL target of ≥ 30% reduction, with more than twice greater odds among patients treated with high-intensity statins compared to those on moderate-intensity [OR: 3.11, 95% CI: (1.08, 8.89), P = 0.034]. Additionally, we found that the odds of achieving the LDL target of ≥ 30% reduction decreased with increasing BMI and each 1 kg/m2 increase in BMI led to a 15% decline in the chance of attaining the target [OR: 0.85, 95% CI: (0.73, 0.99), P = 0.038]. Multivariate analyses also highlighted a direct association between the baseline LDL and achieving LDL goal of ≥ 30% decrease. Each 1 mg/dL increase in baseline LDL level increased the chance of achieving the target by 4% [OR: 1.04, 95% CI: (1.01, 1.07), P = 0.003] (Table 5).
Table 5.
Logistic Regression Analyses Comparing the Main Predictors of Achieving LDL Target ≥ 30% Decrease
|
|
Parameters
|
B
|
SE
|
P Value
|
OR
|
95% CI for OR
|
|
Lower
|
Upper
|
| Model 1 |
Treatment groups |
|
| Moderate-Intensity (Ref) |
— |
| High-intensity |
1.135 |
0.536 |
0.034
|
3.11 |
1.088 |
8.898 |
| BMI (kg/m2) |
-0.164 |
0.079 |
0.038
|
0.849 |
0.727 |
0.991 |
| Baseline LDL (mg/dL) |
0.038 |
0.013 |
0.003
|
1.039 |
1.013 |
1.066 |
| Age (year) |
-0.061 |
0.033 |
0.068 |
0.941 |
0.882 |
1.005 |
| Model 2 |
Treatment groups |
|
| A 20 (Ref) |
— |
| A 40 |
1.465 |
0.771 |
0.057 |
4.330 |
0.956 |
19.616 |
| R 10 |
0.978 |
0.734 |
0.182 |
2.660 |
0.631 |
11.205 |
| R 20 |
1.905 |
0.813 |
0.019
|
6.717 |
1.366 |
33.035 |
| BMI (kg/m2) |
-0.165 |
0.081 |
0.041
|
0.848 |
0.724 |
0.993 |
| Baseline LDL (mg/dL) |
0.041 |
0.014 |
0.003
|
1.041 |
1.014 |
1.070 |
| Age (y) |
-0.063 |
0.034 |
0.069 |
0.939 |
0.878 |
1.005 |
Dependent variable: achievement the target of ≥ 30% reduction in LDL levels; Model 1: multivariate regression model with the study groups categorized based on the treatment intensity; Moderate-intensity group includes those receiving A20 or R10; High-intensity group includes those receiving A40 or R20; Model 2: multivariate logistic regression model with the study groups categorized based on different statin types and dosages; A20, atorvastatin 20 mg; A40, atorvastatin 40 mg; R10, rosuvastatin 10 mg; R20, rosuvastatin 20 mg; BMI, body mass index; LDL, low-density lipoprotein cholesterol. P values that are less than 0.05 are in bold.
Discussion
We found that high-intensity statin therapy increased the chance of achieving the LDL target in people with type 2 diabetes and mild hyperlipidemia. Also, both moderate- and high-intensity statin therapies could significantly reduce the hs-CRP and IL-6 levels in this population.
Isolation of substances from fungi with the ability to impair the activity of HMG-CoA reductase, which is an essential enzyme for cholesterol production, led to the emergence of the most important cholesterol lowering drugs.13 Inhibition of the mentioned enzyme reduces the hepatic cholesterol accumulation and finally ends up in up-regulation of LDL receptors in the liver. This is the mechanism by which statins reduce the LDL level.14 Each 1 mmol/L (38.5 mg/dL) reduction in LDL level after the first year of statin consumption results in about a 25% decrease in major cardiovascular events.15 Established vital benefits, relatively low cost, and minimum adverse effects made them the first-line medical treatment for primary and secondary prevention of ASCVD.16
Moderate- and high-intensity statin therapies are expected to decrease the LDL level by ≥ 30% and ≥ 50%, respectively. However, even after administration of the highest doses of statins, there are a number of patients who still cannot meet the goal.17 A meta-analysis compared the variability of responses to statin use in a large number of patients. In that study, the percentage of patients who failed to reach the LDL target was less than our results in all four treatment subgroups. Namely, 61.9% of patients in our study versus 12.8% in the study by Karlson et al failed to reach ≥ 30% reduction in LDL after daily 20 mg atorvastatin use.17 Only 29% of patients were diabetic in that study and the mean baseline LDL level was significantly higher than our population, which could be the reasons for the observed differences.
All four drugs were successful in lowering LDL; however, the effect of rosuvastatin is more powerful in comparison to other statins.18 This finding is consistent for patients with diabetes.19 According to a meta-analysis of 75 randomized control trials, prescribing a daily dose of 20 mg atorvastatin or 10 mg rosuvastatin can decrease LDL levels by more than 40%.20 Although our findings emphasize the higher potency for rosuvastatin, the overall drug potency for statins was smaller than previous studies and this observation could be due to the relatively lower baseline LDL level in our study population.21,22 Besides, in a population consisting of patients with T2DM, the increased production of very low density lipoprotein (VLDL) in the liver resulting from elevated insulin resistance can interfere with the lipid-lowering ability of the statins.23,24
There are also genetic variations in apolipoprotein E locus which lead to different responses to statins in terms of their LDL lowering effect.25,26 Furthermore, drug pharmacokinetics are not the same in different populations27 and it is shown that higher doses of statins are required for Westerners to reach the same percentage of LDL decline compared to East Asian people.28 Thus, the observed lower efficacy for statins in our study could also be the consequence of the distinct genotype of the study population.
We found that BMI is a confounder for LDL target achievement in people with T2DM and mild hyperlipidemia. The chance of achieving the LDL goal decreased with increasing BMI. It is well-known that obesity alters drug pharmacokinetics and lipid metabolism.29 Dyslipidemia is more prevalent among obese individuals.30 A cross-sectional study investigating the impact of obesity and DM on the LDL therapeutic goal attainment observed that obesity and DM independently predicted failure to reach the LDL goal. According to the receiver operating characteristic (ROC) analysis, individuals with BMI ≥ 28 kg/m2 are at increased risk of inadequate treatment, independent of the statin dose.23 Also, in a large-scale meta-analysis with 265 766 patients reported by Khan et al, individuals with lower BMI ( < 25 kg/m2) showed the greatest risk reduction in myocardial infarction, major adverse cardiovascular events, and cardiovascular mortality following LDL-lowering therapies compared to groups with greater BMI.9 In the current guidelines, there is no recommendation on dose adjustment based on patients’ weight or BMI. However, in a cross-sectional study on 52 916 patients from 30 countries, Ferrières et alshowed a positive correlation between BMI and prescribed daily statin intensity even after adjustment for presence of DM, cerebrovascular, ischemic heart, and peripheral artery diseases.31 This finding is consistent with our results, which demonstrates the better efficacy of statins in patients with lower BMI.
In contrast, there are other investigations claiming that there is no significant association between BMI and LDL goal achievement. In a cross-sectional study on 5718 patients with stable symptomatic ASCVD treated with statins for secondary prevention, Tsai et al found no meaningful relation between the patients’ baseline BMI level and LDL goal achievements. However, patients with higher BMI were more likely not to meet the TG and HDL therapeutic goals.32 In another study, Bhan et al found that obese patients (BMI > 30 kg/m2) were more likely not to reach the therapeutic target for the cholesterol/HDL ratio. However, LDL target ( < 96.7 mg/dL) achievement was not affected by BMI.8 The two above-mentioned studies have some limitations and differences which may explain their inconsistency with our results. Those were cross-sectional and different groups of statins were prescribed by various doctors based on physician’s judgment and there could be considerable inter-physician variations. Also, as guidelines are mostly focused on decreasing the LDL and obesity as well-known risk factors for cardiovascular problems, obese patients tend to be prescribed higher doses of lipid-lowering agents8 which can bias the outcome. Furthermore, the therapeutic target was defined as LDL-C < 100 mg/dL or LDL < 96.7 mg/dL, which is directly affected by the starting value and is different from the goal we set.
As the former treatment goals were set on LDL < 100 mg/dL and LDL < 70 mg/dL for patients at high risk and very high risk of cardiovascular disease,33 the effect of baseline LDL on reaching the targets was biased, because, individuals with a lower starting LDL, even after a small decrease, were considered as patients meeting the goal. However, in high baseline LDL groups, even after greater decreases, they may have not fulfilled the goal. In contrast to the prior research,6,23 we found a significant negative association between baseline LDL and target achievement. To the best of our knowledge, this is the first study evaluating the effect of baseline LDL on current therapeutic goal achievement success; although there are studies on small dense LDL (sd-LDL), which is the most atherogenic subclass of LDL and is believed to have an important role in the development of ASCVD.34 In a meta-analysis reported by Takagi et al, it was noticed that individuals with greater baseline LDL treated with rosuvastatin were more likely to show a significant reduction in sd-LDL.35
In our study both moderate- and high-intensity statin therapies could significantly reduce the hs-CRP and IL-6 levels in patients with T2DM and mild hyperlipidemia. Systemic inflammation is an important precursor for atherosclerosis.36 CRP is the most commonly studied inflammatory marker associated with cardiovascular disease although the causality is still not proven.37 IL-6 is a pro-inflammatory cytokine associated with cardiovascular mortality which has major impact on acute-phase response by inducing CRP synthesis in the liver.38,39 The effect of statins in decreasing CRP and thus reducing cardiovascular problems is well-known40 but the effect is not identical for different statins and in different patients.41,42 In an investigation performed on patients with combined hyperlipidemia (LDL > 130 mg/dL and TG of 200 to 600 mg/dL) by Jialal et al after a 6-week statin administration, the hs-CRP level was significantly decreased in all three groups of 10 mg/d atorvastatin, 20 mg/d simvastatin, and 40 mg/d pravastatin.43 Soran et al reported great variability in hs-CRP response to atorvastatin and although it was reduced following daily 80 mg atorvastatin, the reduction was not statistically significant.44
The mechanism of statins for decreasing CRP is controversial.45 In an in vitro study, Arnaud et al46 showed that statins reduce the effect of IL-6 on hepatocytes for CRP production.46 However, in an in-vivo study performed by Thongtang et al47, there was no significant decrease in CRP production after an 8-week daily consumption of 80 mg atorvastatin and the reduced serum CRP level resulted from increased CRP catabolism. In a systematic review and meta-analysis reported by Tabrizi et al, statins reduced the CRP and IL-6 levels significantly48 and decreased IL-6 could reduce the CRP production. The results of our study mostly concurred with decreasing CRP production by using statins. The subgroup with a significant decrease in hs-CRP in our study also had a reduced level of IL-6. We also believe that the reduction of IL-6 has a temporal priority to hs-CRP decrease. Rosuvastatin subgroups that had a significant decline in IL-6 levels may need a longer period of time to show hs-CRP changes. Further investigations are needed to better understand the drug mechanism.
There are limitations applicable to this investigation. The first limitation is the small number of participants in each group which reduces the power of studying the confounders. Secondly, as all the patients had T2DM, the generalizability of the finding is limited to this specific population. Also, the drug administration period was shorter than a year which is less than the time needed to see the optimal effect of the statins.
In conclusion, despite the general conception, moderate-intensity statins are not adequate for the majority of patients with T2DM and mild hyperlipidemia and greater numbers of patients could reach the LDL cholesterol target with high-intensity statin therapy.
Acknowledgements
We appreciate the staff of the Institute of Endocrinology and Metabolism at Iran University of Medical Sciences (IUMS) and the patients who contributed to the study.
Competing Interests
The authors declare that they have no known competing financial interests or personal relationships that could have appeared to influence the work reported in this paper.
Data Availability Statement
Source data is available from the corresponding author.
Ethical Approval
All subjects gave their informed consent for inclusion before they participated in the study. The study was conducted in accordance with the Declaration of Helsinki, and the protocol was approved by the Ethics Committee of IRAN University of Medical Sciences (Reference Number: IR.IUMS.REC..1397.196).
Funding
The authors received no financial support for the research, authorship, and/or publication of this article.
References
- WHO. The Top 10 Causes of Death. 2020. Available from: https://www.who.int/news-room/fact-sheets/detail/the-top-10-causes-of-death. Accessed August 2023.
- Weir HK, Anderson RN, Coleman King SM, Soman A, Thompson TD, Hong Y. Heart disease and cancer deaths - trends and projections in the United States, 1969-2020. Prev Chronic Dis 2016; 13:E157. doi: 10.5888/pcd13.160211 [Crossref] [ Google Scholar]
- Li Y, Zhao L, Yu D, Ding G. The prevalence and risk factors of dyslipidemia in different diabetic progression stages among middle-aged and elderly populations in China. PLoS One 2018; 13(10):e0205709. doi: 10.1371/journal.pone.0205709 [Crossref] [ Google Scholar]
- Wilson PW, D’Agostino RB, Levy D, Belanger AM, Silbershatz H, Kannel WB. Prediction of coronary heart disease using risk factor categories. Circulation 1998; 97(18):1837-47. doi: 10.1161/01.cir.97.18.1837 [Crossref] [ Google Scholar]
- Arnett DK, Blumenthal RS, Albert MA, Buroker AB, Goldberger ZD, Hahn EJ. 2019 ACC/AHA guideline on the primary prevention of cardiovascular disease: a report of the American College of Cardiology/American Heart Association Task Force on Clinical Practice Guidelines. J Am Coll Cardiol 2019; 74(10):e177-e232. doi: 10.1016/j.jacc.2019.03.010 [Crossref] [ Google Scholar]
- Robinson JG, Ballantyne CM, Hsueh WA, Rosen JB, Lin J, Shah AK. Age, abdominal obesity, and baseline high-sensitivity C-reactive protein are associated with low-density lipoprotein cholesterol, non-high-density lipoprotein cholesterol, and apolipoprotein B responses to ezetimibe/simvastatin and atorvastatin in patients with metabolic syndrome. J Clin Lipidol 2013; 7(4):292-303. doi: 10.1016/j.jacl.2013.03.007 [Crossref] [ Google Scholar]
- American Diabetes Association. 9 Cardiovascular disease and risk management: standards of medical care in diabetes-2018. Diabetes Care 2018; 41(Suppl 1):S86-S104. doi: 10.2337/dc18-S009 [Crossref] [ Google Scholar]
- Bhan V, Yan RT, Leiter LA, Fitchett DH, Langer A, Lonn E. Relation between obesity and the attainment of optimal blood pressure and lipid targets in high vascular risk outpatients. Am J Cardiol 2010; 106(9):1270-6. doi: 10.1016/j.amjcard.2010.06.055 [Crossref] [ Google Scholar]
- Khan SU, Khan MU, Riaz H, Raggi P, Valavoor S, Khan MZ. Meta-analysis of the relation of body mass index to cardiovascular outcomes in patients receiving intensive low-density lipoprotein cholesterol lowering therapy. Am J Cardiol 2020; 125(5):727-34. doi: 10.1016/j.amjcard.2019.12.006 [Crossref] [ Google Scholar]
- Dormuth CR, Filion KB, Paterson JM, James MT, Teare GF, Raymond CB. Higher potency statins and the risk of new diabetes: multicentre, observational study of administrative databases. BMJ 2014; 348:g3244. doi: 10.1136/bmj.g3244 [Crossref] [ Google Scholar]
- Hadjibabaie M, Gholami K, Khalili H, Khoei SH, Nakhjavani M, Rayati K. Comparative efficacy and safety of atorvastatin, simvastatin and lovastatin in the management of dyslipidemic type 2 diabetic patients. Therapy 2006; 3(6):759-64. doi: 10.2217/14750708.3.6.759 [Crossref] [ Google Scholar]
- Jeyaseelan L, Rao PS. Methods of determining sample sizes in clinical trials. Indian Pediatr 1989; 26(2):115-21. [ Google Scholar]
- Endo A. A gift from nature: the birth of the statins. Nat Med 2008; 14(10):1050-2. doi: 10.1038/nm1008-1050 [Crossref] [ Google Scholar]
- Istvan ES, Deisenhofer J. Structural mechanism for statin inhibition of HMG-CoA reductase. Science 2001; 292(5519):1160-4. doi: 10.1126/science.1059344 [Crossref] [ Google Scholar]
- Collins R, Reith C, Emberson J, Armitage J, Baigent C, Blackwell L. Interpretation of the evidence for the efficacy and safety of statin therapy. Lancet 2016; 388(10059):2532-61. doi: 10.1016/s0140-6736(16)31357-5 [Crossref] [ Google Scholar]
- Schaiff RA, Moe RM, Krichbaum DW. An overview of cholesterol management. Am Health Drug Benefits 2008; 1(9):39-48. [ Google Scholar]
- Karlson BW, Wiklund O, Palmer MK, Nicholls SJ, Lundman P, Barter PJ. Variability of low-density lipoprotein cholesterol response with different doses of atorvastatin, rosuvastatin, and simvastatin: results from VOYAGER. Eur Heart J Cardiovasc Pharmacother 2016; 2(4):212-7. doi: 10.1093/ehjcvp/pvw006 [Crossref] [ Google Scholar]
- Stender S, Schuster H, Barter P, Watkins C, Kallend D. Comparison of rosuvastatin with atorvastatin, simvastatin and pravastatin in achieving cholesterol goals and improving plasma lipids in hypercholesterolaemic patients with or without the metabolic syndrome in the MERCURY I trial. Diabetes Obes Metab 2005; 7(4):430-8. doi: 10.1111/j.1463-1326.2004.00450.x [Crossref] [ Google Scholar]
- Fox KM, Gandhi SK, Ohsfeldt RL, Blasetto JW, Bays HE. Effectiveness of rosuvastatin in low-density lipoprotein cholesterol lowering and National Cholesterol Education Program Adult Treatment Panel guideline III LDL-C goal attainment compared to other statins among diabetes mellitus patients: a retrospective study using an electronic medical records dataset in the United States. Curr Med Res Opin 2007; 23(9):2125-33. doi: 10.1185/030079907x219580 [Crossref] [ Google Scholar]
- Weng TC, Yang YH, Lin SJ, Tai SH. A systematic review and meta-analysis on the therapeutic equivalence of statins. J Clin Pharm Ther 2010; 35(2):139-51. doi: 10.1111/j.1365-2710.2009.01085.x [Crossref] [ Google Scholar]
- Law MR, Wald NJ, Rudnicka AR. Quantifying effect of statins on low density lipoprotein cholesterol, ischaemic heart disease, and stroke: systematic review and meta-analysis. BMJ 2003; 326(7404):1423. doi: 10.1136/bmj.326.7404.1423 [Crossref] [ Google Scholar]
- Singh U, Devaraj S, Jialal I, Siegel D. Comparison effect of atorvastatin (10 versus 80 mg) on biomarkers of inflammation and oxidative stress in subjects with metabolic syndrome. Am J Cardiol 2008; 102(3):321-5. doi: 10.1016/j.amjcard.2008.03.057 [Crossref] [ Google Scholar]
- Holecki M, Handzlik-Orlik G, Almgren-Rachtan A, Duława J, Chudek J. The decreased achievement of therapeutic goal in lipid lowering therapy in obese and diabetic patients in Poland. Pharmacol Rep 2017; 69(1):6-12. doi: 10.1016/j.pharep.2016.09.009 [Crossref] [ Google Scholar]
- Gill JM, Brown JC, Bedford D, Wright DM, Cooney J, Hughes DA. Hepatic production of VLDL1 but not VLDL2 is related to insulin resistance in normoglycaemic middle-aged subjects. Atherosclerosis 2004; 176(1):49-56. doi: 10.1016/j.atherosclerosis.2004.04.022 [Crossref] [ Google Scholar]
- Pedro-Botet J, Schaefer EJ, Bakker-Arkema RG, Black DM, Stein EM, Corella D. Apolipoprotein E genotype affects plasma lipid response to atorvastatin in a gender specific manner. Atherosclerosis 2001; 158(1):183-93. doi: 10.1016/s0021-9150(01)00410-5 [Crossref] [ Google Scholar]
- Superko HR, Momary KM, Li Y. Statins personalized. Med Clin North Am 2012; 96(1):123-39. doi: 10.1016/j.mcna.2011.11.004 [Crossref] [ Google Scholar]
- Kim K, Birmingham B, Azumaya C, Chen Y, Schneck D, Zalikowski J. Increased systemic exposure to rosuvastatin in Asian subjects residing in the United States compared to Caucasian subjects. Clin Pharmacol Ther 2008; 83(Suppl 1):S14. [ Google Scholar]
- Naito R, Miyauchi K, Daida H. Racial differences in the cholesterol-lowering effect of statin. J Atheroscler Thromb 2017; 24(1):19-25. doi: 10.5551/jat.RV16004 [Crossref] [ Google Scholar]
- Hanley MJ, Abernethy DR, Greenblatt DJ. Effect of obesity on the pharmacokinetics of drugs in humans. Clin Pharmacokinet 2010; 49(2):71-87. doi: 10.2165/11318100-000000000-00000 [Crossref] [ Google Scholar]
- Bays HE, Chapman RH, Grandy S. The relationship of body mass index to diabetes mellitus, hypertension and dyslipidaemia: comparison of data from two national surveys. Int J Clin Pract 2007; 61(5):737-47. doi: 10.1111/j.1742-1241.2007.01336.x [Crossref] [ Google Scholar]
- Ferrières J, Lautsch D, Gitt AK, De Ferrari G, Toplak H, Elisaf M. Body mass index impacts the choice of lipid-lowering treatment with no correlation to blood cholesterol - findings from 52 916 patients in the Dyslipidemia International Study (DYSIS). Diabetes Obes Metab 2018; 20(11):2670-4. doi: 10.1111/dom.13415 [Crossref] [ Google Scholar]
- Tsai HS, Tseng WK, Yin WH, Lin FJ, Hsuan CF, Wu YW. The correlation between waist-hip ratio and achieving therapeutic lipid goals in Taiwan. Acta Cardiol Sin 2019; 35(6):605-14. doi: 10.6515/acs.201911_35(6).20190403a [Crossref] [ Google Scholar]
- Stone NJ, Robinson JG, Lichtenstein AH, Bairey Merz CN, Blum CB, Eckel RH. 2013 ACC/AHA guideline on the treatment of blood cholesterol to reduce atherosclerotic cardiovascular risk in adults: a report of the American College of Cardiology/American Heart Association Task Force on Practice Guidelines. J Am Coll Cardiol 2014; 63(25 Pt B):2889-934. doi: 10.1016/j.jacc.2013.11.002 [Crossref] [ Google Scholar]
- Gazi IF, Tsimihodimos V, Tselepis AD, Elisaf M, Mikhailidis DP. Clinical importance and therapeutic modulation of small dense low-density lipoprotein particles. Expert Opin Biol Ther 2007; 7(1):53-72. doi: 10.1517/14712598.7.1.53 [Crossref] [ Google Scholar]
- Takagi H, Niwa M, Mizuno Y, Yamamoto H, Goto SN, Umemoto T. Effects of rosuvastatin versus atorvastatin on small dense low-density lipoprotein: a meta-analysis of randomized trials. Heart Vessels 2014; 29(3):287-99. doi: 10.1007/s00380-013-0358-6 [Crossref] [ Google Scholar]
- Libby P, Okamoto Y, Rocha VZ, Folco E. Inflammation in atherosclerosis: transition from theory to practice. Circ J 2010; 74(2):213-20. doi: 10.1253/circj.cj-09-0706 [Crossref] [ Google Scholar]
- Savarese G, Rosano GM, Parente A, D’Amore C, Reiner MF, Camici GG. Reduction of C-reactive protein is not associated with reduced cardiovascular risk and mortality in patients treated with statins A meta-analysis of 22 randomized trials. Int J Cardiol 2014; 177(1):152-60. doi: 10.1016/j.ijcard.2014.09.028 [Crossref] [ Google Scholar]
- Bermudez EA, Rifai N, Buring J, Manson JE, Ridker PM. Interrelationships among circulating interleukin-6, C-reactive protein, and traditional cardiovascular risk factors in women. Arterioscler Thromb Vasc Biol 2002; 22(10):1668-73. doi: 10.1161/01.atv.0000029781.31325.66 [Crossref] [ Google Scholar]
- Su D, Li Z, Li X, Chen Y, Zhang Y, Ding D. Association between serum interleukin-6 concentration and mortality in patients with coronary artery disease. Mediators Inflamm 2013; 2013:726178. doi: 10.1155/2013/726178 [Crossref] [ Google Scholar]
- Everett BM, Glynn RJ, MacFadyen JG, Ridker PM. Rosuvastatin in the prevention of stroke among men and women with elevated levels of C-reactive protein: justification for the Use of Statins in Prevention: an Intervention Trial Evaluating Rosuvastatin (JUPITER). Circulation 2010; 121(1):143-50. doi: 10.1161/circulationaha.109.874834 [Crossref] [ Google Scholar]
- Asher J, Houston M. Statins and C-reactive protein levels. J Clin Hypertens (Greenwich) 2007; 9(8):622-8. doi: 10.1111/j.1524-6175.2007.06639.x [Crossref] [ Google Scholar]
- Schaefer EJ, McNamara JR, Asztalos BF, Tayler T, Daly JA, Gleason JL. Effects of atorvastatin versus other statins on fasting and postprandial C-reactive protein and lipoprotein-associated phospholipase A2 in patients with coronary heart disease versus control subjects. Am J Cardiol 2005; 95(9):1025-32. doi: 10.1016/j.amjcard.2005.01.023 [Crossref] [ Google Scholar]
- Jialal I, Stein D, Balis D, Grundy SM, Adams-Huet B, Devaraj S. Effect of hydroxymethyl glutaryl coenzyme a reductase inhibitor therapy on high sensitive C-reactive protein levels. Circulation 2001; 103(15):1933-5. doi: 10.1161/01.cir.103.15.1933 [Crossref] [ Google Scholar]
- Soran H, Liu Y, Adam S, Siahmansur T, Ho JH, Schofield JD. A comparison of the effects of low- and high-dose atorvastatin on lipoprotein metabolism and inflammatory cytokines in type 2 diabetes: results from the Protection Against Nephropathy in Diabetes with Atorvastatin (PANDA) randomized trial. J Clin Lipidol 2018; 12(1):44-55. doi: 10.1016/j.jacl.2017.10.011 [Crossref] [ Google Scholar]
- Shakour N, Ruscica M, Hadizadeh F, Cirtori C, Banach M, Jamialahmadi T. Statins and C-reactive protein: in silico evidence on direct interaction. Arch Med Sci 2020; 16(6):1432-9. doi: 10.5114/aoms.2020.100304 [Crossref] [ Google Scholar]
- Arnaud C, Burger F, Steffens S, Veillard NR, Nguyen TH, Trono D. Statins reduce interleukin-6-induced C-reactive protein in human hepatocytes: new evidence for direct antiinflammatory effects of statins. Arterioscler Thromb Vasc Biol 2005; 25(6):1231-6. doi: 10.1161/01.ATV.0000163840.63685.0c [Crossref] [ Google Scholar]
- Thongtang N, Diffenderfer MR, Ooi EM, Asztalos BF, Dolnikowski GG, Lamon-Fava S, Schaefer EJ. Effects of atorvastatin on human C-reactive protein metabolism. Atherosclerosis 2013; 226(2):466-70. doi: 10.1016/j.atherosclerosis.2012.11.012 [Crossref] [ Google Scholar]
- Tabrizi R, Tamtaji OR, Mirhosseini N, Lankarani KB, Akbari M, Dadgostar E. The effects of statin use on inflammatory markers among patients with metabolic syndrome and related disorders: a systematic review and meta-analysis of randomized controlled trials. Pharmacol Res 2019; 141:85-103. doi: 10.1016/j.phrs.2018.12.010 [Crossref] [ Google Scholar]