Arch Iran Med. 24(12):869-875.
doi: 10.34172/aim.2021.130
Original Article
Association between Gastric Cancer Mortality-to-Incidence Ratio and Human Development Index: Evidence from the Global Burden of Disease Study 2016
Maryam Nouri 1  , Farid Zayeri 2, * , Mohammad Esmaeil Akbari 1 , Maryam Khayamzadeh 3 , Farid Moradian 1
Author information:
1Cancer Research Center, Shahid Beheshti University of Medical Sciences, Tehran, Iran
2Proteomics Research Center and Department of Biostatistics, School of Allied Medical Sciences, Shahid Beheshti University of Medical Sciences, Tehran, Iran
3Iranian Academy of Medical Sciences, Tehran, Iran
*Corresponding Author: Farid Zayeri, PhD; Proteomics Research Center and Department of Biostatistics, School of Allied Medical Sciences, Shahid Beheshti University of Medical Sciences, Qods Square, Darband Street, Tehran, Iran. Tel:+98-21-22707347; Fax:+98-21-22707347; Email:
fzayeri@gmail.com
Abstract
Background:
Gastric cancer has been one of the major causes of death in the past decades. It is the fifth most prevalent cancer and the third leading cause of neoplasm death worldwide. Thus, to know more about this health problem, assessing the burden of this cancer and its association with socioeconomic status of countries is of great importance. In this study, we aimed to evaluate the mean trend of gastric cancer mortality-to-incidence ratio (GCMIR) in different super regions defined by the Institute for Health Metrics and Evaluation (IHME) and investigate the relationship between GCMIR and Human Development Index (HDI) in the period 2000-2016.
Methods:
We used the data from the Global Burden of Disease (GBD) 2016 study to calculate GCMIR for 185 world countries in the period 2000–2016. We also extracted the HDI data for each year under study from the Updates of the UNDP website. To attain the analytic aims, marginal modeling and generalized estimating equations (GEE) were utilized.
Results:
Sub-Saharan Africa was the only super region with a positive slope of GCMIR, and high-income countries had the greatest decreasing slope of GCMIR during the study period. Moreover, there was a negative association between GCMIR and HDI in these years.
Conclusion: Our findings revealed that gastric cancer could be thought not only as a biological disease but also as a social event that will be more controllable with the improvement of economic status and other social determinants of health.
Keywords: Gastric cancer, Human Development Index, Mortality to incidence ratio, Trend analysis
Copyright and License Information
© 2021 The Author(s).
This is an open-access article distributed under the terms of the Creative Commons Attribution License (
https://creativecommons.org/licenses/by/4.0), which permits unrestricted use, distribution, and reproduction in any medium, provided the original work is properly cited.
Cite this article as: Nouri M, Zayeri F, Akbari ME, Khayamzadeh M, Moradian F. Association between gastric cancer mortality-to-incidence ratio and human development index: evidence from the global burden of disease study 2016. Arch Iran Med. 2021;24(12):869-875. doi: 10.34172/aim.2021.130
Introduction
Non-communicable diseases (NCDs) are currently responsible for the majority of global mortality.1 Cancer is predicted as the second main cause of death in the world and actually, about 1 in 6 deaths is due to cancer.2 In 2018, the estimates showed 18.1 million new cases of cancer (17.0 million excluding non-melanoma skin cancer) and 9.6 million cancer deaths (9.5 million excluding non-melanoma skin cancer) throughout the world.1 The worldwide rise in cancer has been considerable due to the growth and aging of the population, as well as the increasing prevalence of related risk factors.3,4 Among all cancers, gastric cancer is one of the leading causes of death in recent decades.5 Some studies based on the data of 2014 showed gastric cancer to be the fourth most common cancer and the second leading cause of cancer deaths globally.6 However, according to the GLOBOCAN 2018 database, gastric cancer is considered to be the fifth most common cancer, and it is the third leading cause of cancer mortality around the world, with an estimated 783 000 deaths in 2018.7 Some published research in 2002 has shown that 10% of newly diagnosed invasive cancers (excluding non-melanoma skin cancers) are gastric cancer in the world.8
There are various types of occurrence and outcome parameters for measuring the burden of cancers. Epidemiological indices such as prevalence, incidence, mortality, and survival are the most common indicators for assessing the current situation, foreseeing future developments, and allocating resources for different control strategies.9 Some reports have shown that the incidence and mortality rates of gastric cancer have declined over the past decades.6-8,10 The incidence rate of this cancer varies greatly up to ten-folds in different parts of the world.8,11 In 2019, gastric cancer was more diagnosed in developed countries so that the incidence rate of this cancer was 20 per 100 000 and 6.6 per 100 000 for males in high-middle Human Development Index (HDI) and low-middle HDI nations, respectively.7 In addition, it was estimated that gastric cancer in males is diagnosed 2.2 times more than females in developed countries, while this ratio is estimated at 1.83 in developing countries.7 According to a study conducted in 2006, Japan and Korea had the highest gastric cancer incidence rates, and the lowest incidence rates were found in South Asia, North and East Africa, North America, Australia, and New Zealand. Generally, gastric cancer survival rates are found to be better in countries with higher incidence rates.11 The survival rate of this cancer has also continually improved over the past decades due to earlier diagnosis and better treatment methods. The results obtained from a study in 2019 suggested that the five-year survival rates of gastric cancer were 31%, 19%, and 26% in the United States, the United Kingdom, and Europe, respectively.7 The mortality-to-incidence ratio (MIR), as a proxy for both quality of care and early detection of disease, is another popular indicator for assessing the burden of different diseases. Based on a study conducted in 2017, the average MIR of gastric cancer was 0.63 among all Organization for Economic Cooperation and Development (OECD) countries.12
Gastric cancer is a multifactorial disease. A review of the literature about the etiology of this cancer shows that a variety of risk indicators (such as behavioral factors, diet and nutrition, lifestyle, geographical variation, and socioeconomic status) are associated with this cancer.6-8,10,11 Among the mentioned factors, the socioeconomic status of countries plays an important role in the burden of this disease.1 In this context, some researchers believe that the HDI, as a well-known indicator of socioeconomic status, is significantly related to the mortality rate of this cancer.1
The association between HDI and the burden of different cancers has been previously evaluated in several published articles which have yielded controversial findings. For instance, a number of articles have shown that the incidence rate of some cancers (particularly infection-related cancers) are positively related to the HDI level.13,14 In another study, however, the researchers stated that the position of cancers as a cause of premature mortality reflects the national levels of HDI.1 Based on the results of another study, developed regions have lower gastric cancer MIRs than developing countries.10 A study by Hu et al found that HDI and MIR are inversely correlated.15 According to another study, MIRs and health care system rankings have a significant linear relationship for the most of burdensome cancers.12 In previous decades, a number of epidemiologic studies reported different results about the trend of gastric cancer mortality rates across the globe. Some of them showed an increasing trend, while others showed a decreasing pattern.6-8,10,16
Regarding the controversial results obtained from previous studies about the trend of mortality rate of gastric cancer and the relationship between HDI level and burden of this cancer, we decided to use the Global Burden of Disease (GBD) database (the most comprehensive available data about burden of diseases) to achieve the following objectives; first, to evaluate the trend of GCMIR in different IHME (Institute for Health Metrics and Evaluation) super regions and second, to examine the relationship between GCMIR and HDI level in nearly all world countries in the period 2000-2016.
Materials and Methods
GBD Data Set
The GBD study is a collaboration of hundreds of researchers from more than 100 world countries to provide some helpful statistical indices, (such as mortality, prevalence and incidence rates as well as disability-adjusted life years) to quantify health loss from a wide range of known diseases and injuries in nearly all world countries. In the present study, we used the data from the GBD 2016 study to calculate the gastric cancer mortality-to-incidence ratio (GCMIR), as a simple and convenient proxy for both quality of care and early detection of disease, for nearly all world countries in the period of 2000-2016. To compute the MIR values for each country under study, we divided the age-standardized mortality rates by age-standardized incidence rates in this period.
The GBD annually updates about 240 causes of death as well as the standard population of the world countries and territories to provide more reliable and accurate data. Generally, GBD uses complicated country/region-based methods for computing age-standardized rates. In brief, the GBD hierarchically utilizes the data from seven super-regions, 21 regions nested within those super-regions, and 195 countries or territories within the 21 regions. In this process, five types of data sources (Vital Registration systems, sample registration systems, household surveys, censuses and Demographic Surveillance Sites) are employed to estimate age-specific mortality as well as standard population and fertility by age, sex and year for 195 countries and territories as the denominator of the age-standardized rates. To do this, GBD uses different advanced statistical and epidemiological methods such as mixed effects, spatio-temporal regression models and so on to generate more proper rates. Detailed explanation for computing the age-standardized rates in GBD studies can be found elsewhere.17,18 The raw data from the GBD study is publicly available at the IHME website (http://ghdx.healthdata.org/gbd-results-tool).
HDI Dataset
The HDI is a composite statistical tool which combines four different indicators: life expectancy, expected years of schooling, average years of schooling, and gross national income per capita. This index is annually used by the United Nations Development Programme (UNDP) for ranking the countries according to their levels of social and economic development.
In recent years, countries like Norway, Switzerland, Australia, Ireland and Germany have had the highest and some African countries like Niger, Central African Republic, Sudan, Chad and Burundi have had the lowest ranks in this index. In the present study, we extracted the HDI data for each year under study from the Updates of the UNDP website (http://hdr.undp.org/en/data#).
Statistical Analysis
Regarding the main aims of the present study (assessing the trend of GCMIR in different IHME super regions and investigating the relationship between GCMIR and HDI in the period from 2000 to 2016), we used both descriptive and analytic methods for achieving these goals. To describe the GCMIR data, the mean and 95% confidence interval (CI) of ratios were computed using the bootstrap estimating method for different age groups, genders, IHME super regions and categories of HDI in the years 2000, 2005, 2010, 2015, and 2016. In addition, the mean trend of GCMIR was depicted, separately for different IHME super regions and HDI levels.
To achieve the analytic purposes (modeling the mean trend of GCMIR during the study time period), marginal models and generalized estimating equations (GEE) were applied. In this study, the incidence and mortality rates (and subsequently MIRs) were repeatedly (annually) measured for each world country from 2000 to 2016. So, each country acts as a cluster and the repeated MIRs are considered as the longitudinal outcome data. To analyze this longitudinal data, we fitted the described marginal models and the parameters of these models were estimated using the GEE methodology. The standard errors of the parameter estimates were calculated using the robust estimation method. In each marginal model, an appropriate correlation structure (including independent, exchangeable, AR(1), m-dependent and unstructured) was utilized. To choose the best fitted model based on different correlation structures, we computed the QIC and QICC goodness of fit indices. The model with lowest QIC and QICC values was chosen as the model with the best fit.19
Statistical analysis was performed using the SPSS software, version 22.0, and P values less than 0.05 were considered statistically significant.
Results
In this study, the GCMIR and HDI data from 185 world countries were analyzed. In the first step of data analysis, the trend of GCMIR was assessed in the period 2000–2016. Tables 1-3 show these mean trends computed based on bootstrap estimating methods, respectively, by age group, gender and IHME super region. In Table 1, it can be seen that higher age groups experienced higher GCMIR values during these years. At the same time, according to Table 2, one can observe that males and females had relatively similar GCMIR trends over this period of time. Considering Figure 1 and Table 3, we can also conclude that Sub-Saharan Africa was the only super-region with a positive slope during these years. In this period, high-income countries had the greatest decreasing slope of GCMIR. Moreover, the highest and lowest intercepts of GCMIR (ratio in the year 2000) were related to Sub-Saharan Africa and high-income countries, respectively.
Table 1.
Descriptive Statistics for GCMIR by Age Group
|
Age
|
Year
|
|
2000
|
2005
|
2010
|
2015
|
2016
|
| 1 to 4 |
0 |
0 |
0 |
0 |
0 |
| 4 to 9 |
0 |
0 |
0 |
0 |
0 |
| 10 to 14 |
0 |
0 |
0 |
0 |
0 |
| 15 to 19 |
0.55 (0.54–0.57)* |
0.54 (0.53–0.56) |
0.53 (0.51–0.55) |
0.52 (0.50–0.54) |
0.51 (0.50–0.53) |
| 20 to 24 |
0.61 (0.6–0.63) |
0.60 (0.58–0.62) |
0.59 (0.57–0.61) |
0.58 (0.56–0.60) |
0.57 (0.55–0.59) |
| 25 to 29 |
0.67 (0.65–0.68) |
0.65 (0.64–0.67) |
0.64 (0.62–0.66) |
0.63 (0.61–0.65) |
0.62 (0.60–0.64) |
| 30 to 34 |
0.73 (0.71–0.75) |
0.71 (0.69–0.73) |
0.70 (0.67–0.72) |
0.68 (0.66–0.70) |
0.68 (0.65–0.70) |
| 35 to 39 |
0.78 (0.76–0.8) |
0.77 (0.75–79) |
0.75 (0.73–0.77) |
0.74 (0.71–0.76) |
0.73 (0.71–0.76) |
| 40 to 44 |
0.83 (0.81–0.85) |
0.81 (0.79–0.83) |
0.79 (0.77–0.81) |
0.78 (0.75–0.80) |
0.77 (0.74–0.80) |
| 45 to 49 |
0.83 (0.81–0.84) |
0.81 (0.79–0.83) |
0.79 (0.77–0.82) |
0.78 (0.76–0.80) |
0.78 (0.75–0.80) |
| 50 to 54 |
0.85 (0.83–0.86) |
0.83 (0.81–0.85) |
0.82 (0.80–0.84) |
0.81 (0.79–0.83) |
0.80 (0.78–0.82) |
| 55 to 59 |
0.86 (0.84–0.88) |
0.85 (0.83–0.86) |
0.83 (0.81–0.85) |
0.82 (0.80–0.84) |
0.82 (0.80–0.84) |
| 60 to 64 |
0.90 (0.88–0.91) |
0.86 (0.83–0.86) |
0.87 (0.85–0.88) |
0.86 (0.83–0.88) |
0.85 (0.83–0.87) |
| 65 to 69 |
0.93 (0.92–0.95) |
0.88 (0.86–0.90) |
0.90 (0.89–0.92) |
0.89 (0.87–0.91) |
0.89 (0.86–0.91) |
| 70 to 74 |
0.98 (0.97–1.0) |
0.92 (0.90–0.94) |
0.95 (0.93–0.97) |
0.94 (0.91–0.96) |
0.93 (0.91–0.96) |
| 75 to 79 |
1.07 (1.05–1.09) |
1.05 (1.03–1.07) |
1.04 (1.01–1.06) |
1.02 (1.00–1.05) |
1.02 (0.99–1.04) |
| 80 plus |
1.22 (1.24–1.20) |
1.20 (1.18–1.22) |
1.19 (1.17–1.21) |
1.18 (1.16–1.20) |
1.18 (1.15–1.20) |
*The reported statistics are based on bootstrap estimating method.
Table 2.
Descriptive Statistics for GCMIR by Gender
|
Gender
|
Year
|
|
2000
|
2005
|
2010
|
2015
|
2016
|
| Female |
0.99 (0.97–1.00)* |
0.97(0.96–0.99) |
0.97(0.95–0.98) |
0.95(0.94–0.98) |
0.95(0.93–0.97) |
| Male |
0.99 (0.97–1.00) |
0.97(0.95–0.99) |
0.96(0.94–0.98) |
0.95(0.93–0.97) |
0.94(0.92–0.97) |
*The reported statistics are based on bootstrap estimating method.
Table 3.
Descriptive Statistics for GCMIR in Different IHME Super Regions and Related Trend Estimates
|
Super Region
|
Year
|
Parameter
|
95% CI
|
|
2000
|
2005
|
2010
|
2015
|
2016
|
| Central Europe, Eastern Europe, Central Asia |
0.96
(0.92–1.00)* |
0.94
(0.90–0.99) |
0.91
(0.85–0.96) |
0.88
(0.83–0.94) |
0.88
(0.82–0.93) |
Intercept
Slope |
0.958
–0.005 |
0.920, 0.996
–0.007, –0.004 |
| High income |
0.80
(0.75–0.85) |
0.76
(0.71–0.81) |
0.72
(0.67–0.78) |
0.68
(0.63–0.74) |
0.68
(0.63–0.73) |
Intercept
Slope |
0.807
–0.008 |
0.758, 0.856
–0.009, –0.007 |
| Latin America and Caribbean |
1.03
(0.99–1.06) |
1.01
(0.97–1.04) |
0.97
(0.92–1.02) |
0.93
(0.86–0.99) |
0.92
(0.84–0.98) |
Intercept
Slope |
1.019
–0.007 |
0.983, 1.055
–0.009, –0.005 |
| North Africa, Middle East |
1.09
(1.06–1.12) |
1.09
(1.05–1.12) |
1.07
(1.03–1.11) |
1.06
(1.02–1.10) |
1.06
(1.02–1.10) |
Intercept
Slope |
1.089
–0.002 |
1.059, 1.119
–0.004, –0.001 |
| South Asia |
1.03
(0.90–1.14) |
1.04
(0.93–1.14) |
1.04
(0.93–1.14) |
1.04
(0.91–1.16) |
1.04
(0.89–1.16) |
Intercept
Slope |
1.026
0.00 |
0.926, 1.126
–0.007, 0.008 |
| Southeast Asia, East Asia, Oceania |
1.15
(1.09–1.23) |
1.15
(1.08–1.23) |
1.15
(1.08–1.23) |
1.14
(1.06–1.23) |
1.14
(1.06–1.22) |
Intercept
Slope |
1.152
–0.001 |
1.084, 1.220
–0.003, 0.001 |
| Sub–Saharan Africa |
1.25
(1.20–1.29) |
1.25
(1.21–1.30) |
1.28
(1.24–1.32) |
1.31
(1.26–1.35) |
1.31
(1.27–1.36) |
Intercept
Slope |
1.248
0.005 |
1.209, 1.288
0.003, 0.006 |
| Total world |
1.05
(1.02–1.08) |
1.04
(1.01–1.07) |
1.03
(0.99–1.06) |
1.01
(0.97–1.05) |
1.01
(0.97–1.05) |
Intercept
Slope |
1.052
–0.003 |
1.024, 1.080
–0.004, –0.002 |
*The reported statistics are based on bootstrap estimating method.
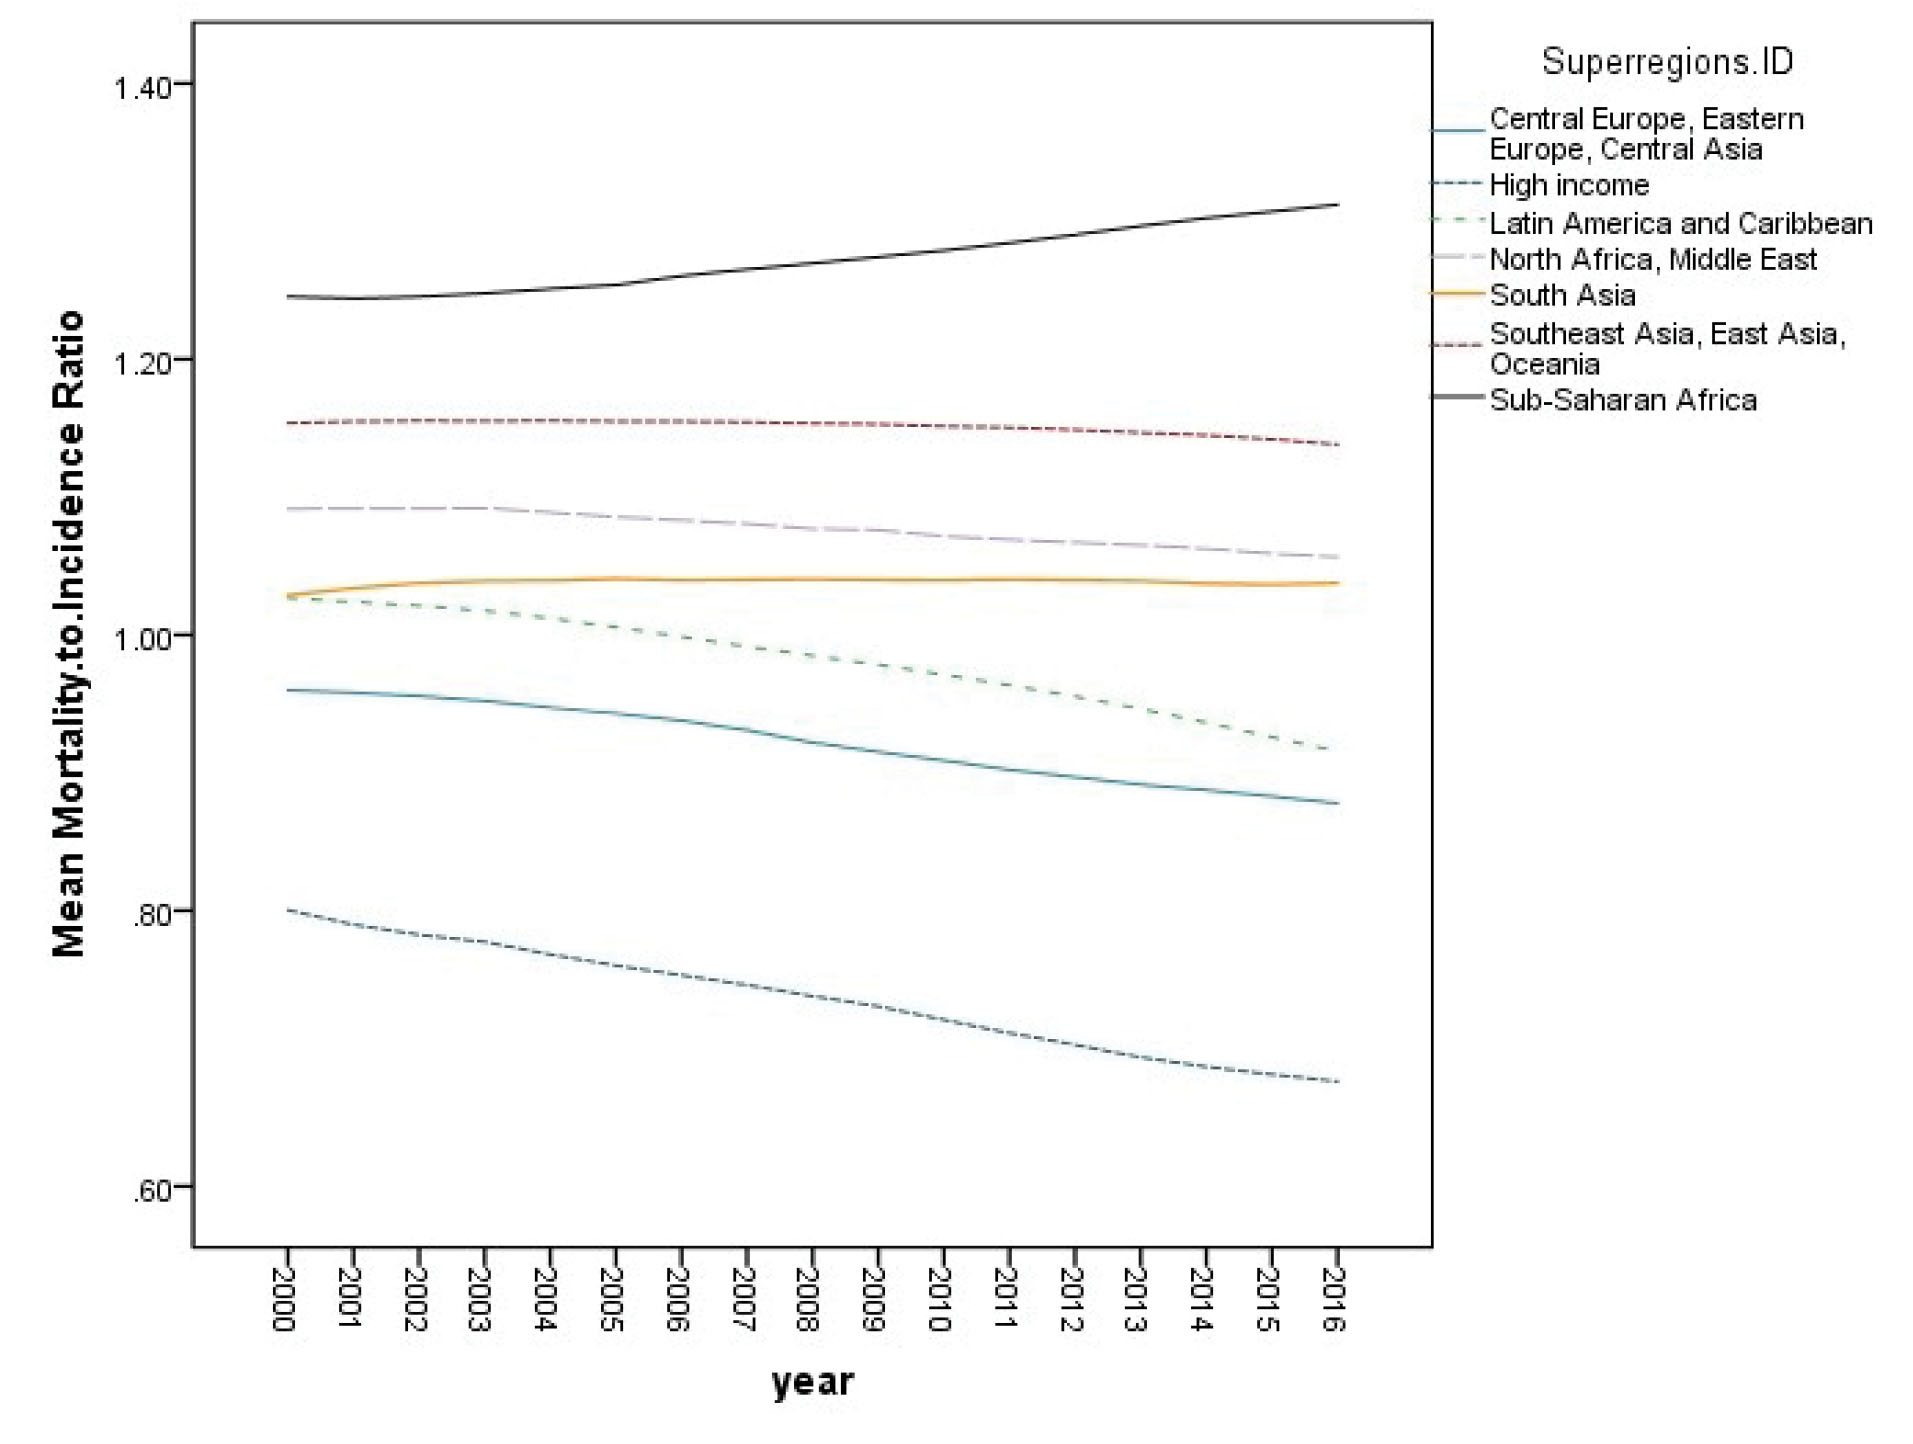
Figure 1.
Mean Trend of Gastric Cancer Mortality–to–Incidence Ratio from 2000 to 2016 by IHME Super Region.
.
Mean Trend of Gastric Cancer Mortality–to–Incidence Ratio from 2000 to 2016 by IHME Super Region.
In the next step of data analysis, we investigated the relationship between longitudinal values of GCMIR and HDI data. Figure 2 displays the mean trend of GCMIR data by HDI level from 2000 to 2016. In addition, Table 4 shows the descriptive statistics of GCMIR values in the years 2000, 2005, 2010, 2015, and 2016, separately for different levels of HDI. According to Figure 2 and Table 4, it can be stated that countries with low and medium HDI had an upward trend, and countries with high and very high HDI had a downward trend of GCMIR in the study time period. As another finding, higher HDI level was related to lower level of GCMIR. In other words, a negative association can be observed between GCMIR and HDI levels in these years.
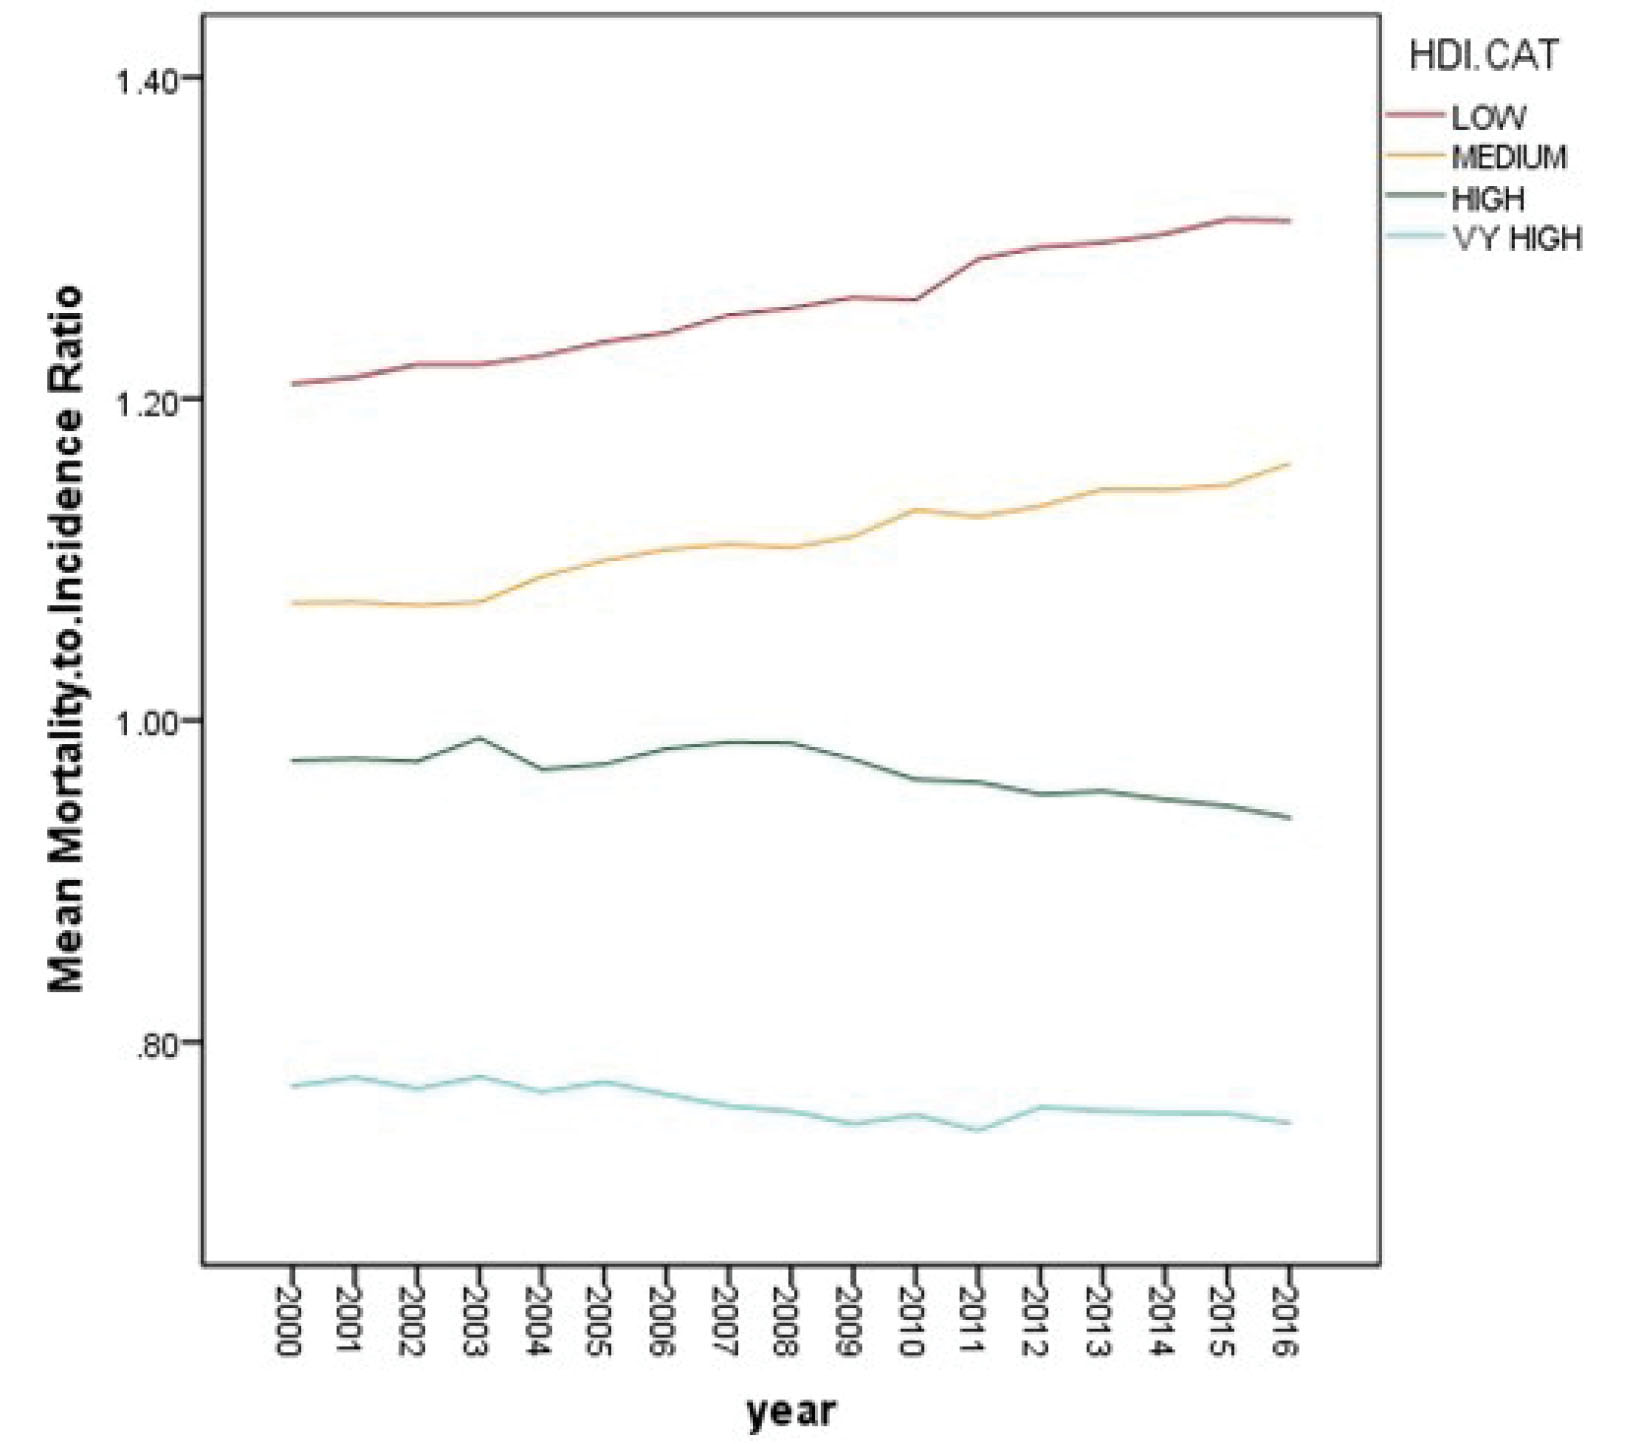
Figure 2.
Mean Trend of Gastric Cancer Mortality–to–Incidence Ratio from 2000 to 2016 by Human Development Index Level.
.
Mean Trend of Gastric Cancer Mortality–to–Incidence Ratio from 2000 to 2016 by Human Development Index Level.
Table 4.
Descriptive Statistics for GCMIR in Different Levels of Human Development index
|
HDI
|
Year
|
|
2000
|
2005
|
2010
|
2015
|
2016
|
| Low |
1.21 (1.16–1.26)* |
1.24 (1.19–1.28) |
1.26 (1.22–1.31) |
1.31 (1.26–1.36) |
1.31(1.26–1.36) |
| Medium |
1.07 (1.04–1.10) |
1.10 (1.07–1.13) |
1.13 (1.09–1.17) |
1.15 (1.10–1.20) |
1.16 (1.11–1.22) |
| High |
0.98 (0.93–1.01) |
0.97 (0.93–1.01) |
0.96 (0.93–1.00) |
0.95 (0.90–1.00) |
0.94(0.89–0.99) |
| Very High |
0.77 (0.73–0.82) |
0.78 (0.73–0.82) |
0.75 (0.71–0.81) |
0.76 (0.71–0.80) |
0.75(0.70–0.79) |
HDI, Human Development Index; GCMIR, gastric cancer mortality-to-incidence ratio.
*The reported statistics are based on bootstrap estimating method.
In the final step of statistical analysis, we modeled the mean trend of GCMIR, separately for different categories of HDI. In this regard, according to the described marginal model in the methods section, we applied the following model for countries with very high, high, medium, and low HDI levels:
𝛍ij = β0 + β1 Time,
where 𝛍ij denotes the mean GCMIR for the ith country at the jth time of measurement (j = 0, 1, 2, 3, 4, 5…, 15, 16). As usual, β0 and β1 show the intercept and slope of mean GCMIR trend, respectively.
Table 5 shows the obtained estimates from these marginal models. The interpretation of the estimates is rather straight-forward. For instance, in countries with a low level of HDI, the estimate of 1.219 for model intercept tells us that these countries had an MIR of 1.22 in the starting year of the study (year 2000). Moreover, the estimate of 0.007 for the time variable (slope of trend) means that countries in the low HDI category experienced an annual increase of 0.007 for MIR during the study period. The estimates for the other HDI categories could be interpreted in a similar manner.
Table 5.
Results of Fitting Marginal Models to GCMIR in Different Levels of HDI
|
HDI
|
Parameter
|
Estimate
|
95%CI
|
P
value
|
| Low |
Intercept |
1.219 |
(1.176, 1.262) |
< 0.001 |
| Slope |
0.007 |
(0.005, 0.008) |
< 0.001 |
| Medium |
Intercept |
1.071 |
(1.036, 1.106) |
< 0.001 |
| Slope |
0.005 |
(0.001, 0.008) |
0.001 |
| High |
Intercept |
0.981 |
(0.944, 1.018) |
< 0.001 |
| Slope |
–0.003 |
(–0.005, –0.001) |
0.041 |
| Very High |
Intercept |
0.776 |
(0.725, 0.827) |
< 0.001 |
| Slope |
–0.003 |
(–0.007, 0.001) |
0.079 |
HDI, Human Development Index; GCMIR, gastric cancer mortality-to-incidence ratio.
Discussion
Gastric cancer is one of the most common and lethal cancers globally. Based on the GLOBOCAN 2018 data, gastric cancer is the 5th most common cancer (over a million new cases are diagnosed each year, worldwide), and it is the 3rd most fatal malignancy, following lung and colorectal cancer in overall mortality (with an evaluated 783 000 deaths in 2018).7 A study on the Iranian National Cancer Registry system data from 2005 to 2014 found that the gastric cancer incidence rate was 2nd in males, 4th in females, and 3rd in both sexes in Iran.20
Although some reports showed that the incidence and mortality rates of gastric cancer have declined over the past decades,6,7 this cancer is still one of the important causes of death.5 Gastric cancer prevalence could be influenced by sanitation, age, diet, food storage, geography, and ethnicity.21 Fortunately, economic advancement has led to better food preservation, improved sanitation, better hygiene, and cleaner water, which have led to a reduction in H. pylori contamination. As a result, the incidence rate of gastric cancer has had dramatically decreasing trend throughout the world and continues to decrease in prevalence among future generations. Moreover, a decrease in the prevalence of Helicobacter pylori and gastric cancer screening and surveillance may be the main reasons for the reduction in the incidence and mortality rates of this cancer.22 This is an important point; several detection and survey of cancer are carried out in countries with high incidence of gastric cancer. This might lead to more cases diagnosed in primary stages and provides favorable clinical outcomes.10 Gastric cancer mortality can be decreased by screening guidelines, early endoscopic findings, disease management, surgery and chemotherapy or targeted therapy.23-25
In this study, we investigated GCMIR for different IHME super regions for the period 2000-2016 using the GBD 2016 data.
Our findings revealed that sub-Saharan Africa was the only super region with a positive slope of GCMIR, while high-income countries had the greatest decreasing slope of GCMIR. The highest and lowest GCMIR rates were associated with sub-Saharan Africa and high income countries (1.25 and 0.81, respectively). In a study on the GLOBOCAN 2012 data to analyze the MIRs for the five most burdensome cancers globally for 34 OECD countries, the average MIR of gastric cancer was 0.63 among all OECD countries.12
The main goal of this study was to assess the relationship between GCMIR and HDI. Generally, HDI is used by researchers as a benchmark for international comparison of development. This index is also utilized as an indicator of the socioeconomic factor of health.15
Our study proved an inverse relation between HDI and GCMIR. In other words, our results showed that in low and medium HDI countries, MIR was remarkably higher than the wealthier parts of the world. In addition, MIR had a downhill trend in high HDI, while it had a rather steady trend in very high HDI areas. It seems that wealthier countries have reached the terminated point of the effect of the HDI on MIR. However, we cannot neglect the aggressive diffuse type and young age event of gastric cancer which is thought to be related to genetic mutation and abnormality and may have less association with the socio-economic condition. In a research conducted on the MIR of gastrointestinal cancers using the GLOBOCAN 2008 database, the researchers reported an inverse correlation between the MIR of gastrointestinal cancers and HDI at regional and national levels. The MIR significantly varied among the four HDI regions (very high HDI, 0.620 ± 0.033; high HDI, 0.807 ± 0.018; medium HDI, 0.857 ± 0.021; low HDI, 0.953 ± 0.011; P < 0.001). In this study, linear regression analysis demonstrated that GCMIR inversely correlates with HDI (P < 0.05).15 In another study conducted on the GLOBOCAN 2012 database for 57 countries, the relationship between GCMIRs and health disparities was evaluated in these countries. The results indicated that developed regions had lower GCMIRs than developing countries.10
The inverse relationship between MIR and HDI demonstrated that differences in cancer care efficiency are caused by variation in healthcare interventions.26
In conclusion,based on the reported decreasing trend of both incidence and mortality rates of gastric cancer in a wide range of studies in the literature, it seems that the downward trend of MIR demonstrates an improvement in the level of care and consequently, the decreasing mortality rate of this disease in most parts of the world. On the other hand, the increasing trend of MIR in less developed countries (countries with low/medium HDI) in recent decades is worrisome. The findings from the present study revealed that gastric cancer is significantly related to the economic status of the countries. Thus, promoting economic indices plays an important role in controlling the burden of this disease in the poorer countries of the world. In this context, health policymakers can design and implement appropriate screening programs to detect disease cases in lower stages and improve the level of care and support systems. By these proceedings, they can take an effective step to reduce the burden of this disease in their countries.
Acknowledgements
This article is part of a research project approved and funded by the Cancer Research Center, Shahid Beheshti University of Medical Sciences, Tehran, Iran. Hereby, the authors wish to express their special thanks to all colleagues in the Cancer Research Center.
Authors’ Contribution
FZ: Designing and leading the study, drafting, and revising the manuscript. MN: Contributed to the study concept and design, extracting the data, interpretation of the data, data analysis, drafting, and revising the manuscript. MEA: Contributed to the study concept and revising the manuscript. MK: Designing the study, interpretation of the data and Contributed to the study concept. FM: Contributed to the study concept.
Conflict of Interest Disclosures
The authors declare that there is no conflict of interest.
Ethical Statement
The Ethics Committee of Shahid Beheshti University of Medical Sciences has approved this study.
References
- Bray F, Ferlay J, Soerjomataram I, Siegel RL, Torre LA, Jemal A. Global cancer statistics 2018: GLOBOCAN estimates of incidence and mortality worldwide for 36 cancers in 185 countries. CA Cancer J Clin 2018; 68(6):394-424. doi: 10.3322/caac.21492 [Crossref] [ Google Scholar]
- World Health Organization. Cancer. Available from: https://www.who.int/news-room/fact-sheets/detail/cancer. Accessed September 21, 2021.
- Sunkara V, Hébert JR. The colorectal cancer mortality-to-incidence ratio as an indicator of global cancer screening and care. Cancer 2015; 121(10):1563-9. doi: 10.1002/cncr.29228 [Crossref] [ Google Scholar]
- Torre LA, Bray F, Siegel RL, Ferlay J, Lortet-Tieulent J, Jemal A. Global cancer statistics, 2012. CA Cancer J Clin 2015; 65(2):87-108. doi: 10.3322/caac.21262 [Crossref] [ Google Scholar]
- Veisani Y, Delpisheh A. Survival rate of gastric cancer in Iran; a systematic review and meta-analysis. Gastroenterol Hepatol Bed Bench 2016; 9(2):78-86. [ Google Scholar]
- Ferro A, Peleteiro B, Malvezzi M, Bosetti C, Bertuccio P, Levi F. Worldwide trends in gastric cancer mortality (1980-2011), with predictions to 2015, and incidence by subtype. Eur J Cancer 2014; 50(7):1330-44. doi: 10.1016/j.ejca.2014.01.029 [Crossref] [ Google Scholar]
- Rawla P, Barsouk A. Epidemiology of gastric cancer: global trends, risk factors and prevention. Prz Gastroenterol 2019; 14(1):26-38. doi: 10.5114/pg.2018.80001 [Crossref] [ Google Scholar]
- Roder DM. The epidemiology of gastric cancer. Gastric Cancer 2002; 5 Suppl 1:5-11. doi: 10.1007/s10120-002-0203-6 [Crossref] [ Google Scholar]
- Asadzadeh Vostakolaei F, Karim-Kos HE, Janssen-Heijnen ML, Visser O, Verbeek AL, Kiemeney LA. The validity of the mortality to incidence ratio as a proxy for site-specific cancer survival. Eur J Public Health 2011; 21(5):573-7. doi: 10.1093/eurpub/ckq120 [Crossref] [ Google Scholar]
- Tsai MC, Wang CC, Lee HL, Peng CM, Yang TW, Chen HY. Health disparities are associated with gastric cancer mortality-to-incidence ratios in 57 countries. World J Gastroenterol 2017; 23(44):7881-7. doi: 10.3748/wjg.v23.i44.7881 [Crossref] [ Google Scholar]
- Crew KD, Neugut AI. Epidemiology of gastric cancer. World J Gastroenterol 2006; 12(3):354-62. doi: 10.3748/wjg.v12.i3.354 [Crossref] [ Google Scholar]
- Choi E, Lee S, Nhung BC, Suh M, Park B, Jun JK. Cancer mortality-to-incidence ratio as an indicator of cancer management outcomes in Organization for Economic Cooperation and Development countries. Epidemiol Health 2017; 39:e2017006. doi: 10.4178/epih.e2017006 [Crossref] [ Google Scholar]
- Bray F, Jemal A, Grey N, Ferlay J, Forman D. Global cancer transitions according to the Human Development Index (2008-2030): a population-based study. Lancet Oncol 2012; 13(8):790-801. doi: 10.1016/s1470-2045(12)70211-5 [Crossref] [ Google Scholar]
- Plummer M, de Martel C, Vignat J, Ferlay J, Bray F, Franceschi S. Global burden of cancers attributable to infections in 2012: a synthetic analysis. Lancet Glob Health 2016; 4(9):e609-16. doi: 10.1016/s2214-109x(16)30143-7 [Crossref] [ Google Scholar]
- Hu QD, Zhang Q, Chen W, Bai XL, Liang TB. Human development index is associated with mortality-to-incidence ratios of gastrointestinal cancers. World J Gastroenterol 2013; 19(32):5261-70. doi: 10.3748/wjg.v19.i32.5261 [Crossref] [ Google Scholar]
- Ferlay J, Shin HR, Bray F, Forman D, Mathers C, Parkin DM. Estimates of worldwide burden of cancer in 2008: GLOBOCAN 2008. Int J Cancer 2010; 127(12):2893-917. doi: 10.1002/ijc.25516 [Crossref] [ Google Scholar]
- Dicker D, Nguyen G, Abate D, Abate KH, Abay SM, Abbafati C. Global, regional, and national age-sex-specific mortality and life expectancy, 1950-2017: a systematic analysis for the Global Burden of Disease Study 2017. Lancet 2018; 392(10159):1684-735. doi: 10.1016/s0140-6736(18)31891-9 [Crossref] [ Google Scholar]
- Murray CJ, Callender CS, Kulikoff XR, Srinivasan V, Abate D, Abate KH. Population and fertility by age and sex for 195 countries and territories, 1950-2017: a systematic analysis for the Global Burden of Disease Study 2017. Lancet 2018; 392(10159):1995-2051. doi: 10.1016/s0140-6736(18)32278-5 [Crossref] [ Google Scholar]
- Fitzmaurice GM, Laird NM, Ware JH. Applied Longitudinal Analysis. 2nd ed. USA: John Wiley & Sons; 2011.
- Akbari A, Khayamzadeh M, Salmanian R, Ghanbari Motlagh A, Roshandel G, Nouri M. National cancer mortality-to-incidence ratio (MIR) in Iran (2005-2014). Int J Cancer Manag 2019; 12(6):e94145. doi: 10.5812/ijcm.94145 [Crossref] [ Google Scholar]
- Seo JY, Jin EH, Jo HJ, Yoon H, Shin CM, Park YS. Clinicopathologic and molecular features associated with patient age in gastric cancer. World J Gastroenterol 2015; 21(22):6905-13. doi: 10.3748/wjg.v21.i22.6905 [Crossref] [ Google Scholar]
- Balakrishnan M, George R, Sharma A, Graham DY. Changing trends in stomach cancer throughout the world. Curr Gastroenterol Rep 2017; 19(8):36. doi: 10.1007/s11894-017-0575-8 [Crossref] [ Google Scholar]
- Berg HH. [Forms of stomach cancer with long survival rate after surgery and early diagnosis]. Radiol Clin 1954; 23(1):1-4. [ Google Scholar]
- Shiraishi K, Mimura K, Izawa S, Inoue A, Shiba S, Maruyama T. Lapatinib acts on gastric cancer through both antiproliferative function and augmentation of trastuzumab-mediated antibody-dependent cellular cytotoxicity. Gastric Cancer 2013; 16(4):571-80. doi: 10.1007/s10120-012-0219-5 [Crossref] [ Google Scholar]
- Lee CM, Choi IK, Kim JH, Park DW, Kim JS, Park SH. Is noncurative gastrectomy always a beneficial strategy for stage IV gastric cancer?. Ann Surg Treat Res 2017; 92(1):23-7. doi: 10.4174/astr.2017.92.1.23 [Crossref] [ Google Scholar]
- Murray SA, Grant E, Grant A, Kendall M. Dying from cancer in developed and developing countries: lessons from two qualitative interview studies of patients and their carers. BMJ 2003; 326(7385):368. doi: 10.1136/bmj.326.7385.368 [Crossref] [ Google Scholar]