Arch Iran Med. 27(2):51-61.
doi: 10.34172/aim.2024.10
Original Article
Epidemiology and Prevalence of Dyslipidemia Among Adult Population of Tehran: The Tehran Cohort Study
Akbar Shafiee Conceptualization, Formal analysis, Methodology, Writing – original draft, Writing – review & editing, 1, # 
Sina Kazemian Visualization, Writing – original draft, Writing – review & editing, 1, 2, #
Arash Jalali Conceptualization, Data curation, Formal analysis, Methodology, Writing – review & editing, 2, 3, *
Farshid Alaeddini Methodology, Validation, Writing – review & editing, 1
Soheil Saadat Conceptualization, Data curation, Validation, Writing – review & editing, 4
Farzad Masoudkabir Conceptualization, Data curation, Visualization, Writing – review & editing, 2
Hamed Tavolinejad Conceptualization, Methodology, Writing – review & editing, 1
Ali Vasheghani-Farahani Supervision, Visualization, Writing – review & editing, 2
Vicente Artola Arita Writing – review & editing, 5
Saeed Sadeghian Conceptualization, Supervision, Writing – review & editing, 1
Mohamamdali Boroumand Conceptualization, Data curation, Visualization, Writing – review & editing, 1
Abbasali Karimi Conceptualization, Data curation, Validation, Writing – review & editing, 1
Oscar H Franco Supervision, Writing – review & editing, 5
Author information:
1Tehran Heart Center, Cardiovascular Diseases Research Institute, Tehran University of Medical Sciences, Tehran, Iran
2Cardiac Primary Prevention Research Center, Cardiovascular Diseases Research Institute, Tehran University of Medical Sciences, Tehran, Iran
3Department of Epidemiology and Biostatistics, School of Public Health, Tehran University of Medical Sciences, Tehran, Iran
4Department of Emergency Medicine, University of California, Irvine, California, USA
5Julius Center for Health Sciences and Primary Care, University Medical Center Utrecht, Utrecht, the Netherlands
#Akbar Shafiee and Sina Kazemian contributed equally to the work as first authors.
Abstract
Background:
Dyslipidemia is among the leading risk factors for cardiovascular diseases (CVDs), with an increasing global burden, especially in developing countries. We investigated the prevalence of dyslipidemia and abnormal lipid profiles in Tehran.
Methods:
We used data from 8072 individuals aged≥35 from the Tehran Cohort Study (TeCS) recruitment phase. Fasting serum total cholesterol (TC), low-density lipoprotein-cholesterol (LDL-C), high-density lipoprotein-cholesterol (HDL-C), and triglyceride were measured. Dyslipidemia was defined according to the National Cholesterol Education Program Adult Treatment Panel III criteria, and high LDL/HDL was defined as a ratio>2.5. The age-sex standardized prevalence rates were calculated based on the 2016 national census. Furthermore, the geographical distribution of dyslipidemia and lipid abnormalities was investigated across Tehran’s zip code districts.
Results:
The age-sex standardized prevalence was 82.7% (95% CI: 80.1%, 85.0%) for dyslipidemia, 36.9% (95% CI: 33.8%, 40.1%) for hypertriglyceridemia, 22.5% (95% CI: 19.9%, 25.4%) for hypercholesterolemia, 29.0% (95% CI: 26.1%, 32.1%) for high LDL-C, 55.9% (95% CI: 52.6%, 59.2%) for low HDL-C, and 54.1% (95% CI: 50.9%, 57.3%) for high LDL/HDL ratio in the Tehran adult population. The prevalence of dyslipidemia, low HDL-C, and high LDL/HDL ratio was higher in the northern regions, hypercholesterolemia was higher in the southern half, and high LDL-C was more prevalent in the middle-northern and southern areas of Tehran.
Conclusion:
We found a high prevalence of dyslipidemia, mainly high LDL/HDL in the Tehran adult population. This dyslipidemia profiling provides important information for public health policy to improve preventive interventions and reduce dyslipidemiarelated morbidity and mortality in the future.
Keywords: Dyslipidemia, Epidemiology, Hypercholesterolemia, Hypertriglyceridemia, Prevalence
Copyright and License Information
© 2024 The Author(s).
This is an open-access article distributed under the terms of the Creative Commons Attribution License (
https://creativecommons.org/licenses/by/4.0), which permits unrestricted use, distribution, and reproduction in any medium, provided the original work is properly cited.
Cite this article as: Shafiee A, Kazemian S, Jalali A, Alaeddini F, Saadat S, Masoudkabir F, et al. Epidemiology and prevalence of dyslipidemia among adult population of Tehran: the Tehran cohort study. Arch Iran Med. 2024;27(2):51-61. doi: 10.34172/ aim.2024.10
Introduction
Cardiovascular diseases (CVDs) represent the primary cause of mortality and disease burden worldwide.1 The prevalence of CVDs has nearly doubled since 1990 and reached 523 million cases in 2019; a steady increase in the mortality rate has been observed throughout these years.1 Dyslipidemia is among the leading risk factors for CVDs that has been tightly knotted with atherosclerosis pathophysiology and plaque formation, known as the leading underlying cause of CVDs.2-4 The global burden of dyslipidemia showed an increasing trend due to the aging population, inadequate physical activity, behavioral risk factors, and obesity, particularly in developing countries.1,5 In 2015, Iran was the third most affected country in the Eastern-Mediterranean region with 54.1% prevalence of hypercholesterolemia and recorded 46% of CVD deaths according to the World Health Organization (WHO) estimates.6
Tehran is the capital and the most populated city of Iran; it is also recognized as the third largest metropolitan area in the Eastern Mediterranean region, with more than 9 million population and significant ethnic diversity.7 A nationwide survey in 2021 found that about 81% of the Iranian adult population had at least one lipid abnormality, and several studies have reported different rates of dyslipidemia across various regions of the country.8-11 Previous epidemiological studies in Tehran were limited by district-level samplings, and small sample sizes, with uncertainties regarding the current prevalence of dyslipidemia rates in Tehran.12-14
Nevertheless, the current understanding of dyslipidemia prevalence in Tehran remains limited, particularly across its diverse districts and among different age and sex groups. It is essential to highlight that recognizing the epidemiology of dyslipidemia as a modifiable cardiovascular risk factor could lead to more effective prioritization of interventions. Such targeted strategies, based on regional profiling, hold significant potential for controlling and preventing CVDs. In this study, we aim to investigate the prevalence of dyslipidemia, its geographic distribution and associated risk factors among participants of the Tehran Cohort Study (TeCS).
Materials and Methods
Study Design and Participants
In this study, we used the TeCS recruitment data, an ongoing prospective population-based cohort study of adult citizens of Tehran aged 35 and above. Details of the TeCS design and sampling have been previously published.15 In summary, a total of 9,170 adults aged ≥ 35 years were selected from 4215 households using a systematic random sampling method based on their residential zip codes to represent all districts of Tehran. We invited all the participating individuals for an interview and initial evaluation at the Tehran Heart Center, and 8296 individuals underwent assessment from May 2016 to February 2019. For this analysis, we excluded 224 patients who lacked information on dyslipidemia history. Furthermore, 122 participants who underwent non-fasting laboratory sampling were excluded from the analysis of lipid test results.
Data Collection and Measurements
We interviewed every participant using a designated comprehensive checklist on demographic characteristics, drug, and past medical history, family history of coronary artery disease (CAD), smoking, and drinking habits. In addition, we used physical activity questions from the STEPs instrument version 3.2 to measure the participants’ physical activity levels.16 All participants underwent standard anthropometric evaluation, including body height, weight, waist, and hip circumference measurements by a trained nurse. Besides, blood pressure was measured on the left arm in a standard setting by a trained nurse using a digital sphygmomanometer (M6 Comfort Omron, Omron Healthcare, Kyoto, Japan).17 If the first recording was above 140/90 mm Hg, we performed a subsequent measurement on the same arm following a five-minute rest period. Afterward, a venous blood sample was obtained from every individual following a 12-hour overnight fast to check fasting plasma glucose (FPG), creatinine, total cholesterol (TC), low-density lipoprotein-cholesterol (LDL-C), high-density lipoprotein-cholesterol (HDL-C), and triglyceride. The biochemistry measurements were performed by the experienced laboratory staff at Tehran Heart Center using Roche kits (Roche Diagnostics, Basel, Switzerland) and COBAS Integra 400 plus device (Roche Diagnostics, Basel, Switzerland).
Definitions
Dyslipidemia was defined based on laboratory findings, previous diagnosis, or self-reported use of lipid-lowering medications, in accordance with the Third Report of the National Cholesterol Education Program, Expert Panel on Detection, Evaluation, and Treatment of High Blood Cholesterol in Adult Treatment Panel III.18 Individuals with either one or a combination of hypercholesterolemia, high LDL-C, low HDL-C, and hypertriglyceridemia were considered to have dyslipidemia. Hypercholesterolemia was characterized as TC concentrations of ≥ 200 mg/dL (≥ 5.2 mmol/L), high LDL-C defined as LDL-C ≥ 130 mg/dL (≥ 3.4 mmol/L), low HDL-C defined as HDL-C < 40 mg/dL (< 1.03 mmol/L) in men, and < 50 mg/dL (< 1.29 mmol/L) in women, hypertriglyceridemia was characterized as triglyceride ≥ 150 mg/dL (≥ 1.7 mmol/L), and high LDL/HDL as ratio > 2.5.18,19
Hypertension was defined as increased systolic blood pressure (SBP) ≥ 140 mm Hg or diastolic blood pressure (DBP) ≥ 90 mm Hg), previous hypertension diagnosis, or antihypertensive treatment.20 Diabetes mellitus was described as a self-report of previous diabetes mellitus diagnosis or treatment with oral antidiabetic agents, insulin, or FPG ≥ 126 mg/dL (7.0 mmol/L) after 8-12 hours of overnight fasting. Cerebrovascular disease was determined based on a prior history of stroke or transient ischemic attack. We calculated the mean arterial pressure (MAP) using the following equation: (SBP + 2*DBP)/3.
Statistical Analysis
In this study, categorical variables were presented as numbers (percentages) and compared for differences between groups using the chi-square test. Continuous variables were presented as mean ± standard deviation and assessed between the groups using either an independent t test or one-way analysis of variance (ANOVA) test, as appropriate. Furthermore, skew-distributed variables were reported as median with interquartile range boundaries and compared using the Mann–Whitney U test. The age-sex standardized prevalence of dyslipidemia and abnormal lipid profile were estimated in both men and women considering their age distribution, consistent with the 2016 national census, and was described with a 95% confidence interval (CI). Furthermore, we illustrated the prevalence of dyslipidemia and impaired lipid profile in different zip code regions on the Tehran map using shp2dta and spmap modules that visualize spatial data from every region onto the map in the Stata statistical software, version 14.2. Statistical analyses were performed by SPSS Statistics for Windows, version 23.0 (Armonk, NY: IBM Corp.). A two-sided P value < 0.05 was considered statistically significant.
Results
This study analyzed data from 8072 individuals (97.3% of total TeCS participants). The mean age was 53.8 ± 12.71, and 4375 (54.2%) were women. The mean body mass index (BMI) was 28.0 ± 4.8 kg/m2, while 5762 (72.1%) and 2426 (30.3%) were in the overweight and obese range, respectively. The most common comorbidities were dyslipidemia, hypertension, and diabetes mellitus. The baseline characteristics of the study participants are reported in (Table 1).
Table 1.
Baseline Characteristics of Participants and Comparison Between the Individuals With and Without Dyslipidemia
|
Characteristics
|
Total (N=8072)
|
Dyslipidemiaa
(n=6716)
|
Non-dyslipidemia (n=1356)
|
P
valueb
|
| Age, year |
53.8 ± 12.7 |
54.3 ± 12.5 |
51.3 ± 13.2 |
< 0.001 |
| Sex, n (%) |
Women |
4375 (54.2) |
3635 (54.1) |
740 (54.6) |
0.763 |
| Men |
3697 (45.8) |
3081 (45.9) |
616 (45.4) |
| BMI, kg/m2 |
28.0 ± 4.8 |
28.4 ± 4.7 |
26.1 ± 4.9 |
< 0.001 |
| BMI Subgroups, n (%) |
< 20 |
218/7996 (2.7) |
100/6649 (1.5) |
118/1347 (8.8) |
< 0.001 |
| 20-24.9 |
2016/7996 (25.2) |
1521/6649 (22.9) |
495/1347 (36.7) |
| 25-29.9 |
3336/7996 (41.7) |
2867/6649 (43.1) |
469/1347 (34.8) |
| 30-34.5 |
1761/7996 (22.0) |
1560/6649 (23.5) |
201/1347 (14.9) |
| ≥ 35 |
665/7996 (8.3) |
601/6649 (9.0) |
64/1347 (4.8) |
| Waist-to-hip ratio |
0.92 ± 0.07 |
0.92 ± 0.07 |
0.89 ± 0.08 |
< 0.001 |
| Education years, n (%) |
Illiterate |
568/8053 (7.1) |
510/6699 (7.6) |
58/1354 (4.3) |
< 0.001 |
| 1-5 |
821/8053 (10.2) |
712/6699 (10.6) |
109/1354 (8.1) |
| 6-12 |
4194/8053 (52.1) |
3499/6699 (52.2) |
695/1354 (51.3) |
| > 12 |
2470/8053 (30.7) |
1978/6699 (29.5) |
492/1354 (36.3) |
| Diabetes mellitus, n (%) |
1491/8025 (18.6) |
1384/6669 (20.8) |
107/1356 (7.9) |
< 0.001 |
| Hypertension, n (%) |
2291/8057 (28.4) |
2087/6701 (31.1) |
204/1356 (15.0) |
< 0.001 |
| Coronary heart disease, n (%) |
767/8058 (9.5) |
716/6703 (10.7) |
51/1355 (3.8) |
< 0.001 |
| Cerebrovascular disease, n (%) |
118/8057 (1.5) |
107/6702 (1.6) |
11/1355 (0.8) |
0.029 |
| Chronic kidney disease, n (%) |
70/8072 (0.9) |
66/6716 (1.0) |
4/1356 (0.3) |
0.013 |
| Statin, n (%) |
1757/8053 (21.8) |
1757/6699 (26.2) |
0 (0.0%) |
< 0.001 |
| Non-statin lipid-lowering agents, n (%) |
162/8053 (2.0) |
162/6699 (2.4) |
0 (0.0%) |
< 0.001 |
| Family history of CAD, n (%) |
758/8072 (9.4) |
640/6716 (9.5) |
118/1356 (8.7) |
0.341 |
| Tobacco, n (%) |
Current |
1551/8054 (19.3) |
1265/6700 (18.9) |
286/1354 (21.1) |
0.030 |
| Former |
323/8054 (4.0) |
282/6700 (4.2) |
41/1354 (3.0) |
| Never |
6180/8054 (76.7) |
5153/6700 (76.9) |
1027/1354 (75.8) |
| Alcohol, n (%) |
718/8022 (9.0) |
591/6675 (8.9) |
127/1347 (9.4) |
0.501 |
| Physical activity, n (%) |
Low |
1415/7996 (17.7) |
1228/6651 (18.5) |
187/1345 (13.9) |
< 0.001 |
| Medium |
4645/7996 (58.1) |
3891/6651 (58.5) |
754/1345 (56.1) |
| High |
1936/7996 (24.2) |
1532/6651 (23.0) |
404/1345 (30.0) |
| SBP, mmHg |
121.8 ± 18.84 |
122.8 ± 18.77 |
117.3 ± 18.52 |
< 0.001 |
| DBP, mmHg |
80.8 ± 10.82 |
81.1 ± 10.87 |
79.1 ± 10.44 |
< 0.001 |
| MAP, mmHg |
94.5 ± 12.37 |
95.0 ± 12.37 |
91.9 ± 12.07 |
< 0.001 |
| FPG, mg/dL |
97.0 [90.0, 107.0] |
98.0 [91.0, 109.0] |
94.0 [88.0, 100.0] |
< 0.001 |
| Creatinine, mg/dL |
0.80 [0.70, 0.94] |
0.80 [0.70, 0.95] |
0.79 [0.69, 0.91] |
< 0.001 |
| Total cholesterol, mg/dL |
170.0 [145.0, 197.0] |
173.0 [144.0, 203.0] |
162.0 [146.0, 177.0] |
< 0.001 |
| LDL-C, mg/dL |
111.0 [90.0, 134.0] |
115.0 [90.0, 139.0] |
102.0 [86.0, 115.0] |
< 0.001 |
| HDL-C, mg/dL |
43.0 [36.0, 52.0] |
41.0 [35.0, 49.0] |
53.0 [47.0, 60.0] |
< 0.001 |
| Triglyceride, mg/dL |
124.0 [88.0, 175.0] |
139.0 [98.0, 188.0] |
80.0 [63.0, 103.0] |
< 0.001 |
BMI, body mass index; CAD, coronary artery disease; DBP, diastolic blood pressure; HDL-C, high-density lipoprotein-cholesterol; LDL-C: low-density lipoprotein-cholesterol; MAP, mean arterial pressure; SBP, systolic blood pressure.
Categorical variables were presented as numbers (percentages in the column). Numerical variables were presented as mean ± standard deviation in a normally distributed variable and median [interquartile range] in non-parametric data.
aDyslipidemia was defined based on laboratory findings, previous diagnosis, or self-reported use of lipid-lowering medications.
bP values < 0.05 were statistically significant.
Prevalence
In this study, the overall prevalence of dyslipidemia was 83.2%. The most common lipid abnormality was low HDL-C, with a prevalence of 55.1%, followed by hypertriglyceridemia at 36.4%, high LDL-C at 23.1%, and hypercholesterolemia at 23.1%, respectively. The age-sex standardized prevalence of dyslipidemia was estimated to be 82.7% (95% CI: 80.1%-85.0%) in Tehran. The age-sex standardized prevalence for each lipid abnormality is presented in (Table 2). We found a higher prevalence of dyslipidemia, hypercholesterolemia, high LDL-C, and low HDL-C in women; however, hypertriglyceridemia and high LDL/HDL ratio were significantly more common in men (Table 3 and Table 4). The mean age was considerably higher in those with hypercholesterolemia, while low HDL-C and high LDL/HDL ratio were more frequent at a younger age. We observed no age differences in participants with high LDL-C or hypertriglyceridemia.
Table 2.
Age-sex Standardized Prevalence of Dyslipidemia and Abnormal Lipid Biomarkers in Tehran
|
|
Dyslipidemiaa
|
Hypertriglyceridemiab
|
Hypercholesterolemiab
|
High LDL-Cb
|
Low HDL-Cb
|
High LDL/HDLb
|
| Total (%) |
82.7 (80.1, 85.0) |
36.9 (33.8, 40.1) |
22.5 (19.9, 25.4) |
29.0 (26.1, 32.1) |
55.9 (52.6, 59.2) |
54.1 (50.9, 57.3) |
| Women (%) |
82.1 (79.7, 84.3) |
31.6 (28.7, 34.6) |
25.8 (23.1, 28.7) |
30.5 (27.7, 33.5) |
56.5 (53.2, 59.6) |
43.2 (40.0, 46.4) |
| Men (%) |
83.3 (80.6, 85.8) |
42.4 (39.1, 45.8) |
19.1 (16.6, 22) |
27.4 (24.5, 30.6) |
55.3 (51.9, 58.7) |
65.3 (62.0, 68.5) |
HDL-C, high-density lipoprotein-cholesterol; LDL-C, low-density lipoprotein-cholesterol.
The age-sex standardized prevalence was reported as a percentage (95% confidence interval).
aDyslipidemia was defined based on laboratory findings, previous diagnosis, or self-reported use of lipid-lowering medications.
bHypercholesterolemia was defined as total cholesterol ≥ 200 mg/dL (≥ 5.2 mmol/L), high LDL-C defined as LDL-C ≥ 130 mg/dL (≥ 3.4 mmol/L), low HDL-C defined as HDL-C < 40 mg/dL (< 1.03 mmol/L) in men, and < 50 mg/dL (< 1.29 mmol/L) in women, hypertriglyceridemia was defined as triglyceride ≥ 150 mg/dL (≥ 1.7 mmol/L), and high LDL/HDL as ratio > 2.5.
Table 3.
Comparison of the Participants’ Characteristics Within Abnormal Triglyceride and Total Cholesterol Subgroups in the Cohort Population Irrespective of Dyslipidemia History
|
|
Triglyceride
|
P
Valueb
|
Total Cholesterol
|
P
Valueb
|
|
Higha
(N=2892 [36.4%])
|
Normal (N=5058 [63.6%])
|
Higha
(N=1837 [23.1%])
|
Normal
(N=6113 [76.9%])
|
| Age, year |
53.5 ± 11.7 |
53.8 ± 13.2 |
0.310 |
54.5 ± 11.6 |
53.5 ± 13.0 |
0.001 |
| Gender, n (%) |
Women |
1397 (48.3) |
2909 (57.5) |
< 0.001 |
1149 (62.5) |
3157 (51.6) |
< 0.001 |
| Men |
1495 (51.7) |
2149 (42.5) |
|
688 (37.5) |
2956 (48.4) |
| BMI, kg/m2 |
29.1 ± 4.6 |
27.4 ± 4.8 |
< 0.001 |
28.4 ± 4.6 |
27.9 ± 4.9 |
< 0.001 |
| BMI subgroups, n (%) |
< 20 |
15 (0.5) |
203 (4.1) |
< 0.001 |
27 (1.5) |
191 (3.2) |
< 0.001 |
| 20-24.9 |
509 (17.7) |
1473 (29.5) |
|
404 (22.3) |
1578 (26.0) |
| 25-29.9 |
1288 (44.8) |
2009 (40.2) |
|
783 (43.3) |
2514 (41.5) |
| 30-34.5 |
764 (26.6) |
958 (19.2) |
|
443 (24.5) |
1279 (21.1) |
| ≥ 35 |
296 (10.3) |
357 (7.1) |
|
153 (8.5) |
500 (8.2) |
| Waist-to-hip ratio |
0.93 ± 0.07 |
0.91 ± 0.07 |
< 0.001 |
0.92 ± 0.07 |
0.91 ± 0.07 |
0.121 |
| Education years, n (%) |
Illiterate |
212 (7.4) |
341 (6.8) |
0.501 |
132 (7.2) |
421 (6.9) |
0.817 |
| 1-5 |
287 (10.0) |
515 (10.2) |
|
187 (10.2) |
615 (10.1) |
| 6-12 |
1518 (52.6) |
2613 (51.8) |
|
952 (52.2) |
3179 (52.1) |
| > 12 |
867 (30.1) |
1574 (31.2) |
|
554 (30.4) |
1887 (30.9) |
| Diabetes mellitus, n (%) |
678 (23.4) |
775 (15.3) |
< 0.001 |
276 (15.0) |
1177 (19.3) |
< 0.001 |
| Hypertension, n (%) |
916 (31.7) |
1307 (25.9) |
< 0.001 |
468 (25.6) |
1755 (28.8) |
0.009 |
| Coronary heart disease, n (%) |
272 (9.4) |
462 (9.2) |
0.696 |
97 (5.3) |
637 (10.4) |
< 0.001 |
| Cerebrovascular disease, n (%) |
40 (1.4) |
69 (1.4) |
0.948 |
18 (1.0) |
91 (1.5) |
0.104 |
| Chronic kidney disease, n (%) |
29 (1.0) |
41 (0.8) |
0.378 |
13 (0.7) |
57 (0.9) |
0.366 |
| Statin, n (%) |
702 (24.3) |
979 (19.4) |
< 0.001 |
236 (12.9) |
1445 (23.7) |
< 0.001 |
| Non-statin lipid-lowering agents, n (%) |
101 (3.5) |
53 (1.0) |
< 0.001 |
43 (2.3) |
111 (1.8) |
0.145 |
| Family history of CAD, n (%) |
281 (9.7) |
470 (9.3) |
0.534 |
183 (10.0) |
568 (9.3) |
0.389 |
| Tobacco, n (%) |
Current |
598 (20.7) |
934 (18.5) |
0.008 |
334 (18.3) |
1198 (19.6) |
0.102 |
| Former |
129 (4.5) |
186 (3.7) |
|
61 (3.3) |
254 (4.2) |
| Never |
2158 (74.8) |
3922 (77.8) |
|
1431 (78.4) |
4649 (76.2) |
| Alcohol, n (%) |
310 (10.8) |
401 (8.0) |
< 0.001 |
186 (10.2) |
525 (8.6) |
0.040 |
| Physical activity, n (%) |
Low |
533 (18.6) |
851 (17.0) |
0.001 |
336 (18.5) |
1048 (17.3) |
0.238 |
| Medium |
1696 (59.3) |
2877 (57.4) |
|
1024 (56.4) |
3549 (58.6) |
| High |
629 (22.0) |
1284 (25.6) |
|
455 (25.1) |
1458 (24.1) |
| SBP, mmHg |
124.6 ± 18.6 |
120.1 ± 18.8 |
< 0.001 |
124.1 ± 19.2 |
121.1 ± 18.6 |
< 0.001 |
| DBP, mmHg |
82.3 ± 10.8 |
79.9 ± 10.7 |
< 0.001 |
82.9 ± 11.1 |
80.1 ± 10.7 |
< 0.001 |
| MAP, mmHg |
96.4 ± 12.3 |
93.3 ± 12.2 |
< 0.001 |
96.6 ± 12.7 |
93.8 ± 12.2 |
< 0.001 |
| FPG, mg/dL |
100.0 [93.0, 114.0] |
96.0 [89.0, 104.0] |
< 0.001 |
98.0 [92.0, 108.0] |
97.0 [90.0, 107.0] |
< 0.001 |
| Creatinine, mg/dL |
0.83 [0.71, 0.97] |
0.80 [0.69, 0.92] |
< 0.001 |
0.80 [0.70, 0.93] |
0.80 [0.70, 0.94] |
0.765 |
BMI, body mass index; CAD: coronary artery disease; DBP, diastolic blood pressure; MAP, mean arterial pressure; SBP, systolic blood pressure.
Categorical variables were presented as numbers (percentages in the column). Numerical variables were presented as mean ± standard deviation in normally distributed variables and median [interquartile range] in non-parametric data.
aHigh triglyceride was defined as triglyceride ≥ 150 mg/dL (≥ 1.7 mmol/L) and high total cholesterol was defined as total cholesterol ≥ 200 mg/dL (≥ 5.2 mmol/L).
bP values < 0.05 were statistically significant.
Table 4.
Comparison of the Participants’ Characteristics within Abnormal LDL-C, HDL-C, and LDL/HDL Ratio Subgroups in Cohort Population Irrespective of Dyslipidemia History
|
|
LDL-Ca
|
P
Valueb
|
HDL-C
|
P
Valueb
|
LDL/HDL Ratio
|
P
Valueb
|
|
Higha
(N=2332 [29.3%])
|
Normal (N=5618 [70.7%])
|
Lowa
(N=4383 [55.1%])
|
Normal (N=3567 [44.9%])
|
Higha
(N=4174 [52.5%])
|
Normal (N=3776 [47.5%])
|
| Age, year |
|
53.9 ± 11.7 |
53.6 ± 13.1 |
0.339 |
52.7 ± 12.4 |
54.9 ± 12.9 |
< 0.001 |
52.8 ± 12.1 |
54.7 ± 13.3 |
< 0.001 |
| Gender, n (%) |
Women |
1349 (57.8) |
2957 (52.6) |
< 0.001 |
2419 (55.2) |
1887 (52.9) |
0.042 |
1871 (44.8) |
2435 (64.5) |
< 0.001 |
| Men |
983 (42.2) |
2661 (47.4) |
|
1964 (44.8) |
1680 (47.1) |
|
2303 (55.2) |
1341 (35.5) |
|
| BMI, kg/m2 |
|
28.3 ± 4.7 |
27.8 ± 4.9 |
< 0.001 |
28.6 ± 4.8 |
27.2 ± 4.7 |
< 0.001 |
28.4 ± 4.6 |
27.5 ± 5.0 |
< 0.001 |
| BMI subgroups, n (%) |
< 20 |
38 (1.7) |
180 (3.2) |
< 0.001 |
53 (1.2) |
165 (4.7) |
< 0.001 |
59 (1.4) |
159 (4.3) |
< 0.001 |
| 20-24.9 |
525 (22.8) |
1457 (26.2) |
|
926 (21.3) |
1056 (29.9) |
|
889 (21.5) |
1093 (29.2) |
|
| 25-29.9 |
1021 (44.4) |
2276 (40.9) |
|
1872 (43.1) |
1425 (40.4) |
|
1839 (44.5) |
1458 (39.0) |
|
| 30-34.5 |
520 (22.6) |
1202 (21.6) |
|
1064 (24.5) |
658 (18.7) |
|
989 (23.9) |
733 (19.6) |
|
| ≥ 35 |
198 (8.6) |
455 (8.2) |
|
431 (9.9) |
222 (6.3) |
|
359 (8.7) |
294 (7.9) |
|
| Waist-to-hip ratio |
|
0.92 ± 0.07 |
0.91 ± 0.07 |
0.013 |
0.92 ± 0.07 |
0.91 ± 0.08 |
< 0.001 |
0.93 ± 0.07 |
0.90 ± 0.08 |
< 0.001 |
| Education years, n (%) |
Illiterate |
156 (6.7) |
397 (7.1) |
0.179 |
340 (7.8) |
213 (6.0) |
0.022 |
274 (6.6) |
279 (7.4) |
0.524 |
| 1-5 |
238 (10.2) |
564 (10.1) |
|
488 (11.1) |
314 (8.8) |
|
419 (10.1) |
383 (10.2) |
|
| 6-12 |
1214 (52.3) |
2917 (52.0) |
|
2293 (52.4) |
1838 (51.8) |
|
2186 (52.5) |
1945 (51.6) |
|
| > 12 |
714 (30.7) |
1727 (30.8) |
|
1256 (28.7) |
1185 (33.4) |
|
1281 (30.8) |
1160 (30.8) |
|
| Diabetes mellitus, n (%) |
|
320 (13.7) |
1133 (20.2) |
< 0.001 |
891 (20.3) |
562 (15.8) |
< 0.001 |
650 (15.6) |
803 (21.3) |
< 0.001 |
| Hypertension, n (%) |
|
555 (23.9) |
1668 (29.7) |
< 0.001 |
1295 (29.6) |
928 (26.1) |
0.001 |
1019 (24.5) |
1204 (31.9) |
< 0.001 |
| Coronary heart disease, n (%) |
|
123 (5.3) |
611 (10.9) |
< 0.001 |
422 (9.6) |
312 (8.8) |
0.191 |
264 (6.3) |
470 (12.5) |
< 0.001 |
| Cerebrovascular disease, n (%) |
|
23 (1.0) |
86 (1.5) |
0.059 |
70 (1.6) |
39 (1.1) |
0.057 |
50 (1.2) |
59 (1.6) |
0.164 |
| Chronic kidney disease, n (%) |
|
13 (0.6) |
57 (1.0) |
0.047 |
49 (1.1) |
21 (0.6) |
0.012 |
33 (0.8) |
37 (1.0) |
0.367 |
| Statin, n (%) |
|
236 (10.2) |
1445 (25.8) |
< 0.001 |
952 (21.8) |
729 (20.5) |
0.188 |
495 (11.9) |
1186 (31.5) |
< 0.001 |
| Non-statin lipid-lowering agents, n (%) |
|
42 (1.8) |
112 (2.0) |
0.578 |
113 (2.6) |
41 (1.1) |
< 0.001 |
87 (2.1) |
67 (1.8) |
0.314 |
| Family history of CAD, n (%) |
|
226 (9.7) |
525 (9.3) |
0.631 |
451 (10.3) |
300 (8.4) |
0.004 |
386 (9.2) |
365 (9.7) |
0.524 |
| Tobacco, n (%) |
Current |
431 (18.6) |
1101 (19.6) |
0.064 |
857 (19.6) |
675 (19.0) |
0.203 |
948 (22.8) |
584 (15.5) |
< 0.001 |
| Former |
77 (3.3) |
238 (4.2) |
|
159 (3.6) |
156 (4.4) |
|
159 (3.8) |
156 (4.1) |
|
| Never |
1815 (78.1) |
4265 (76.1) |
|
3360 (76.8) |
2720 (76.6) |
|
3053 (73.4) |
3027 (80.4) |
|
| Alcohol, n (%) |
|
213 (9.2) |
498 (8.9) |
0.689 |
348 (8.0) |
363 (10.3) |
< 0.001 |
424 (10.2) |
287 (7.7) |
< 0.001 |
| Physical activity, n (%) |
Low |
397 (17.2) |
987 (17.8) |
0.126 |
833 (19.2) |
551 (15.6) |
< 0.001 |
708 (17.1) |
676 (18.1) |
0.515 |
| Medium |
1317 (57.0) |
3256 (58.6) |
|
2586 (59.5) |
1987 (56.4) |
|
2420 (58.6) |
2153 (57.6) |
|
| High |
597 (25.8) |
1316 (23.7) |
|
925 (21.3) |
988 (28.0) |
|
1003 (24.3) |
910 (24.3) |
|
| SBP, mm Hg |
|
123.5 ± 19.0 |
121.0 ± 18.7 |
< 0.001 |
121.9 ± 18.6 |
121.5 ± 19.1 |
0.328 |
123.1 ± 18.5 |
120.2 ± 19.0 |
< 0.001 |
| DBP, mm Hg |
|
82.3 ± 11.0 |
80.2 ± 10.7 |
< 0.001 |
80.9 ± 10.8 |
80.6 ± 10.8 |
0.170 |
81.7 ± 10.9 |
79.7 ± 10.6 |
< 0.001 |
| MAP, mm Hg |
|
96.0 ± 12.6 |
93.8 ± 12.2 |
< 0.001 |
94.6 ± 12.2 |
94.2 ± 12.5 |
0.202 |
95.5 ± 12.4 |
93.2 ± 12.2 |
< 0.001 |
| FPG, mg/dL |
|
98.0 [92.0, 107.0] |
97.0 [90.0, 107.0] |
< 0.001 |
98.0 [90.0, 109.0] |
96.0 [91.0, 105.0] |
< 0.001 |
98.0 [92.0, 107.0] |
96.0 [89.0, 106.0] |
< 0.001 |
| Creatinine, mg/dL |
|
0.81 [0.70, 0.94] |
0.80 [0.70, 0.94] |
0.023 |
0.80 [0.69, 0.93] |
0.81 [0.70, 0.95] |
< 0.001 |
0.83 [0.71, 0.96] |
0.78 [0.68, 0.90] |
< 0.001 |
BMI, body mass index; CAD: coronary artery disease; DBP, diastolic blood pressure; HDL-C, high-density lipoprotein-cholesterol; LDL-C, low-density lipoprotein-cholesterol; MAP, mean arterial pressure; SBP, systolic blood pressure.
aHigh LDL-C defined as LDL-C ≥ 130 mg/dL (≥ 3.4 mmol/L), low HDL-C defined as HDL-C < 40 mg/dL (< 1.03 mmol/L) in men, and < 50 mg/dL (< 1.29 mmol/L) in women, and high LDL/HDL as ratio > 2.5.
bP values < 0.05 were statistically significant.
Categorical variables were presented as numbers (percentages in the column). Numerical variables were presented as mean ± standard deviation in normally distributed variables and median [interquartile range] in non-parametric data.
Dyslipidemia and Abnormal Lipid Profile
We found that individuals with dyslipidemia were more likely to be older, overweight (BMI ≥ 25; 75.6% vs. 54.5%, P value < 0.001), or obese (BMI ≥ 30; 32.5% vs. 19.7%, P value < 0.001) compared to those without dyslipidemia. Additionally, dyslipidemia was associated with lower physical activity, higher waist-to-hip ratio, and all comorbidities including diabetes mellitus, hypertension, CAD, cerebrovascular disease, and chronic kidney disease. Moreover, these individuals had higher SBP, DBP, MAP, FPG, and creatinine levels during their first visit compared to those without dyslipidemia. Nevertheless, a family history of CAD did not influence the frequency of dyslipidemia (P value: 0.341) (Table 1).
After excluding 122 patients due to non-fasting laboratory test results, we compared the baseline characteristics of entire cohort participants within the abnormal lipid profile subgroups irrespective of dyslipidemia history (Table 3 and Table 4). Our results demonstrated that high BMI was associated with a higher prevalence of all lipid abnormalities. In addition, individuals with a higher waist-to-hip ratio were more likely to have abnormal lipid profiles except for hypercholesterolemia. We found that patients with diabetes, hypertension, or CAD had lower TC, LDL-C, and LDL/HDL ratios; however, they had a higher frequency of low HDL-C and hypertriglyceridemia. In terms of smoking and drinking habits, not having a history of tobacco smoking was associated with a considerably lower triglyceride level. Participants with a history of alcohol consumption were found to have a greater prevalence of hypercholesterolemia, and triglyceridemia, with higher HDL-C levels and LDL/HDL ratio.
Age-Sex Disparities
The prevalence of dyslipidemia and abnormal lipid profiles were evaluated in both men and women in five different age groups (Figure 1, Table S1). There was an increasing pattern for dyslipidemia with aging followed by a decrease in the ‘ + 75 years’ group (Figure 1A). Furthermore, the prevalence of hypertriglyceridemia, hypercholesterolemia, and high LDL-C increased with aging, peaked in the ‘55-64 years’ group, and decreased afterward (Figure 1B-D).
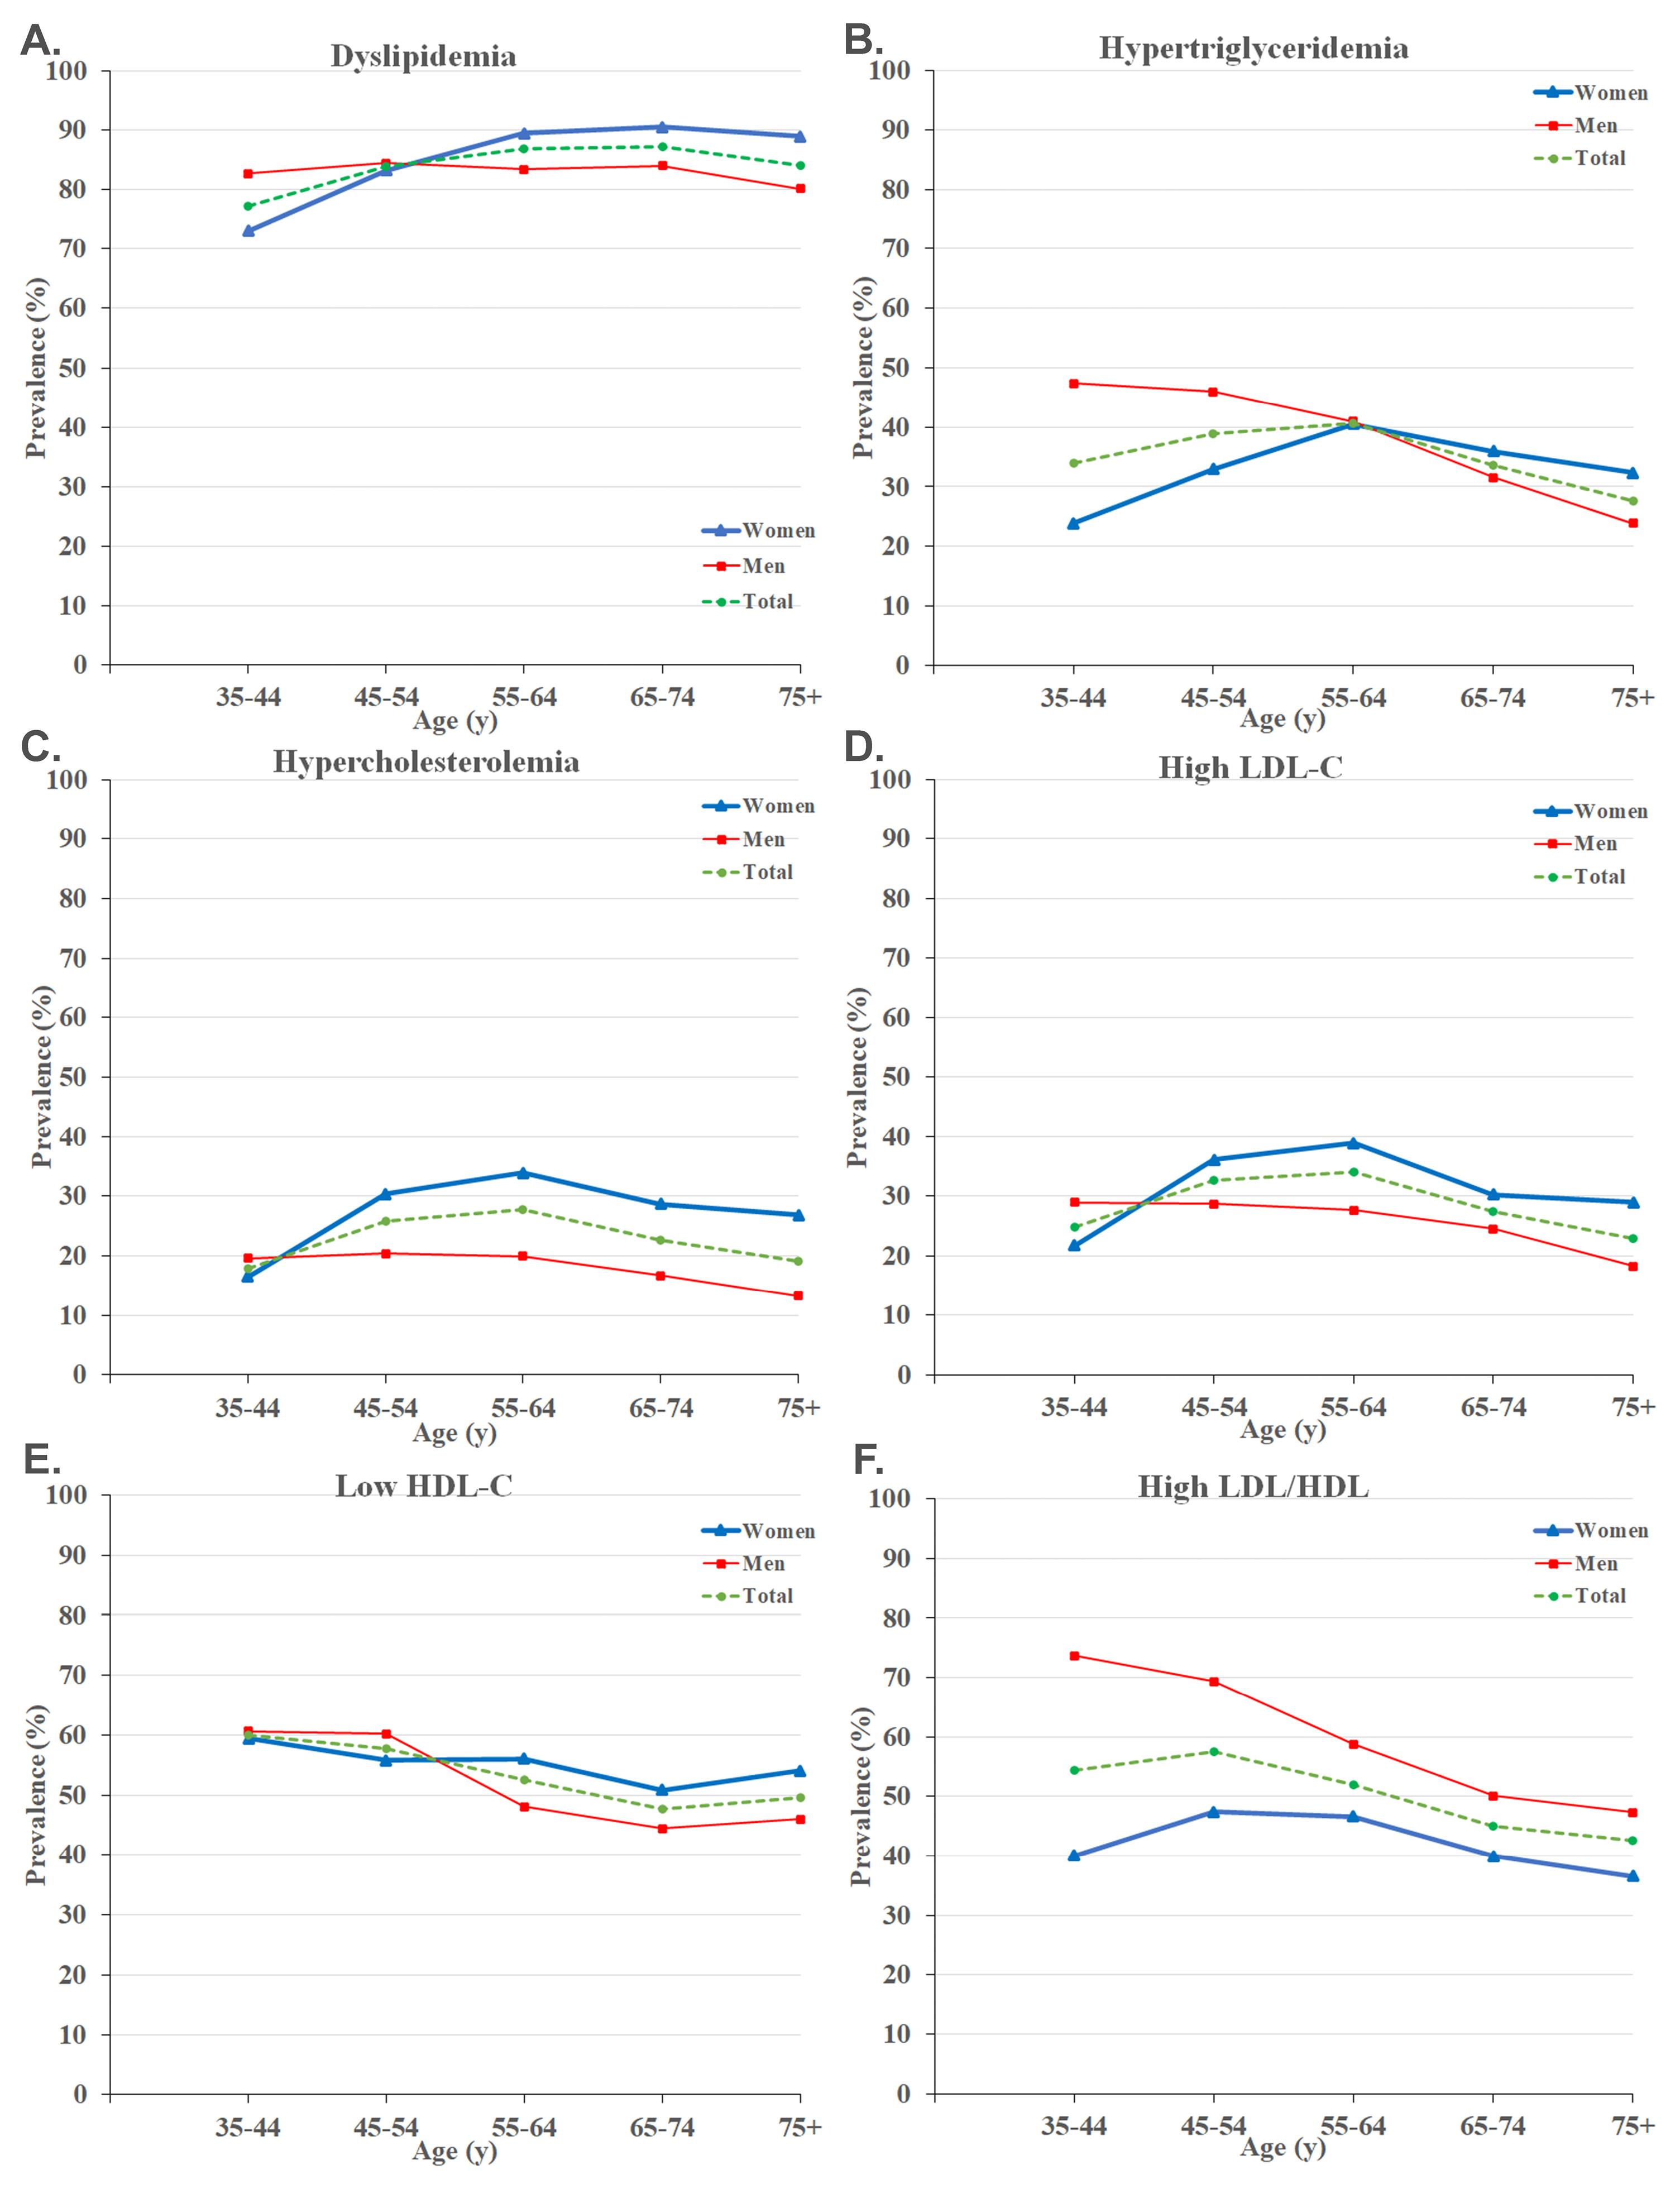
Figure 1.
Prevalence of Dyslipidemia (A), Hypertriglyceridemia (B), Hypercholesterolemia(C), High LDL-C (D), Low HDL-C (E), and High LDL/HDL Ratio (F) Stratified by Age and Sex. HDL-C, high-density lipoprotein cholesterol; LDL-C, low-density lipoprotein cholesterol
.
Prevalence of Dyslipidemia (A), Hypertriglyceridemia (B), Hypercholesterolemia(C), High LDL-C (D), Low HDL-C (E), and High LDL/HDL Ratio (F) Stratified by Age and Sex. HDL-C, high-density lipoprotein cholesterol; LDL-C, low-density lipoprotein cholesterol
Regarding sex differences, men had a considerably higher prevalence of dyslipidemia among individuals aged 35-44. Moreover, dyslipidemia showed a rising trend in women as they aged, with women being more prone to dyslipidemia after the age of 55 compared to men (Figure 1A). We observed similar increasing patterns for hypercholesterolemia and high LDL-C, peaking in the ‘55-64 years’ group. Women had a significantly higher prevalence of hypercholesterolemia and high LDL-C in individuals aged ≥ 45 years (Figure 1C-D). It was found that hypertriglyceridemia was significantly more common in men < 55 years and low HDL-C in men aged 45-54 years (Figure 1B and Figure 1E). Eventually, significantly higher LDL/HDL ratios were observed in men across all ages, with the highest difference of 33.6% in the ‘35-44 years’ group (Figure 1F, Table S1).
Geographical Distribution
The geographical distribution of our findings based on zip code districts of Tehran illustrates that the prevalence of dyslipidemia, low HDL-C, and high LDL/HDL ratio was higher in the northern half of Tehran (Figure 2A, E, F). In addition, hypercholesterolemia was higher in the southern half, and high LDL-C was more prevalent in the middle-northern and southern regions of Tehran (Figure 2C, D). However, we observed no specific distributional pattern for hypertriglyceridemia in different areas (Figure 2B).
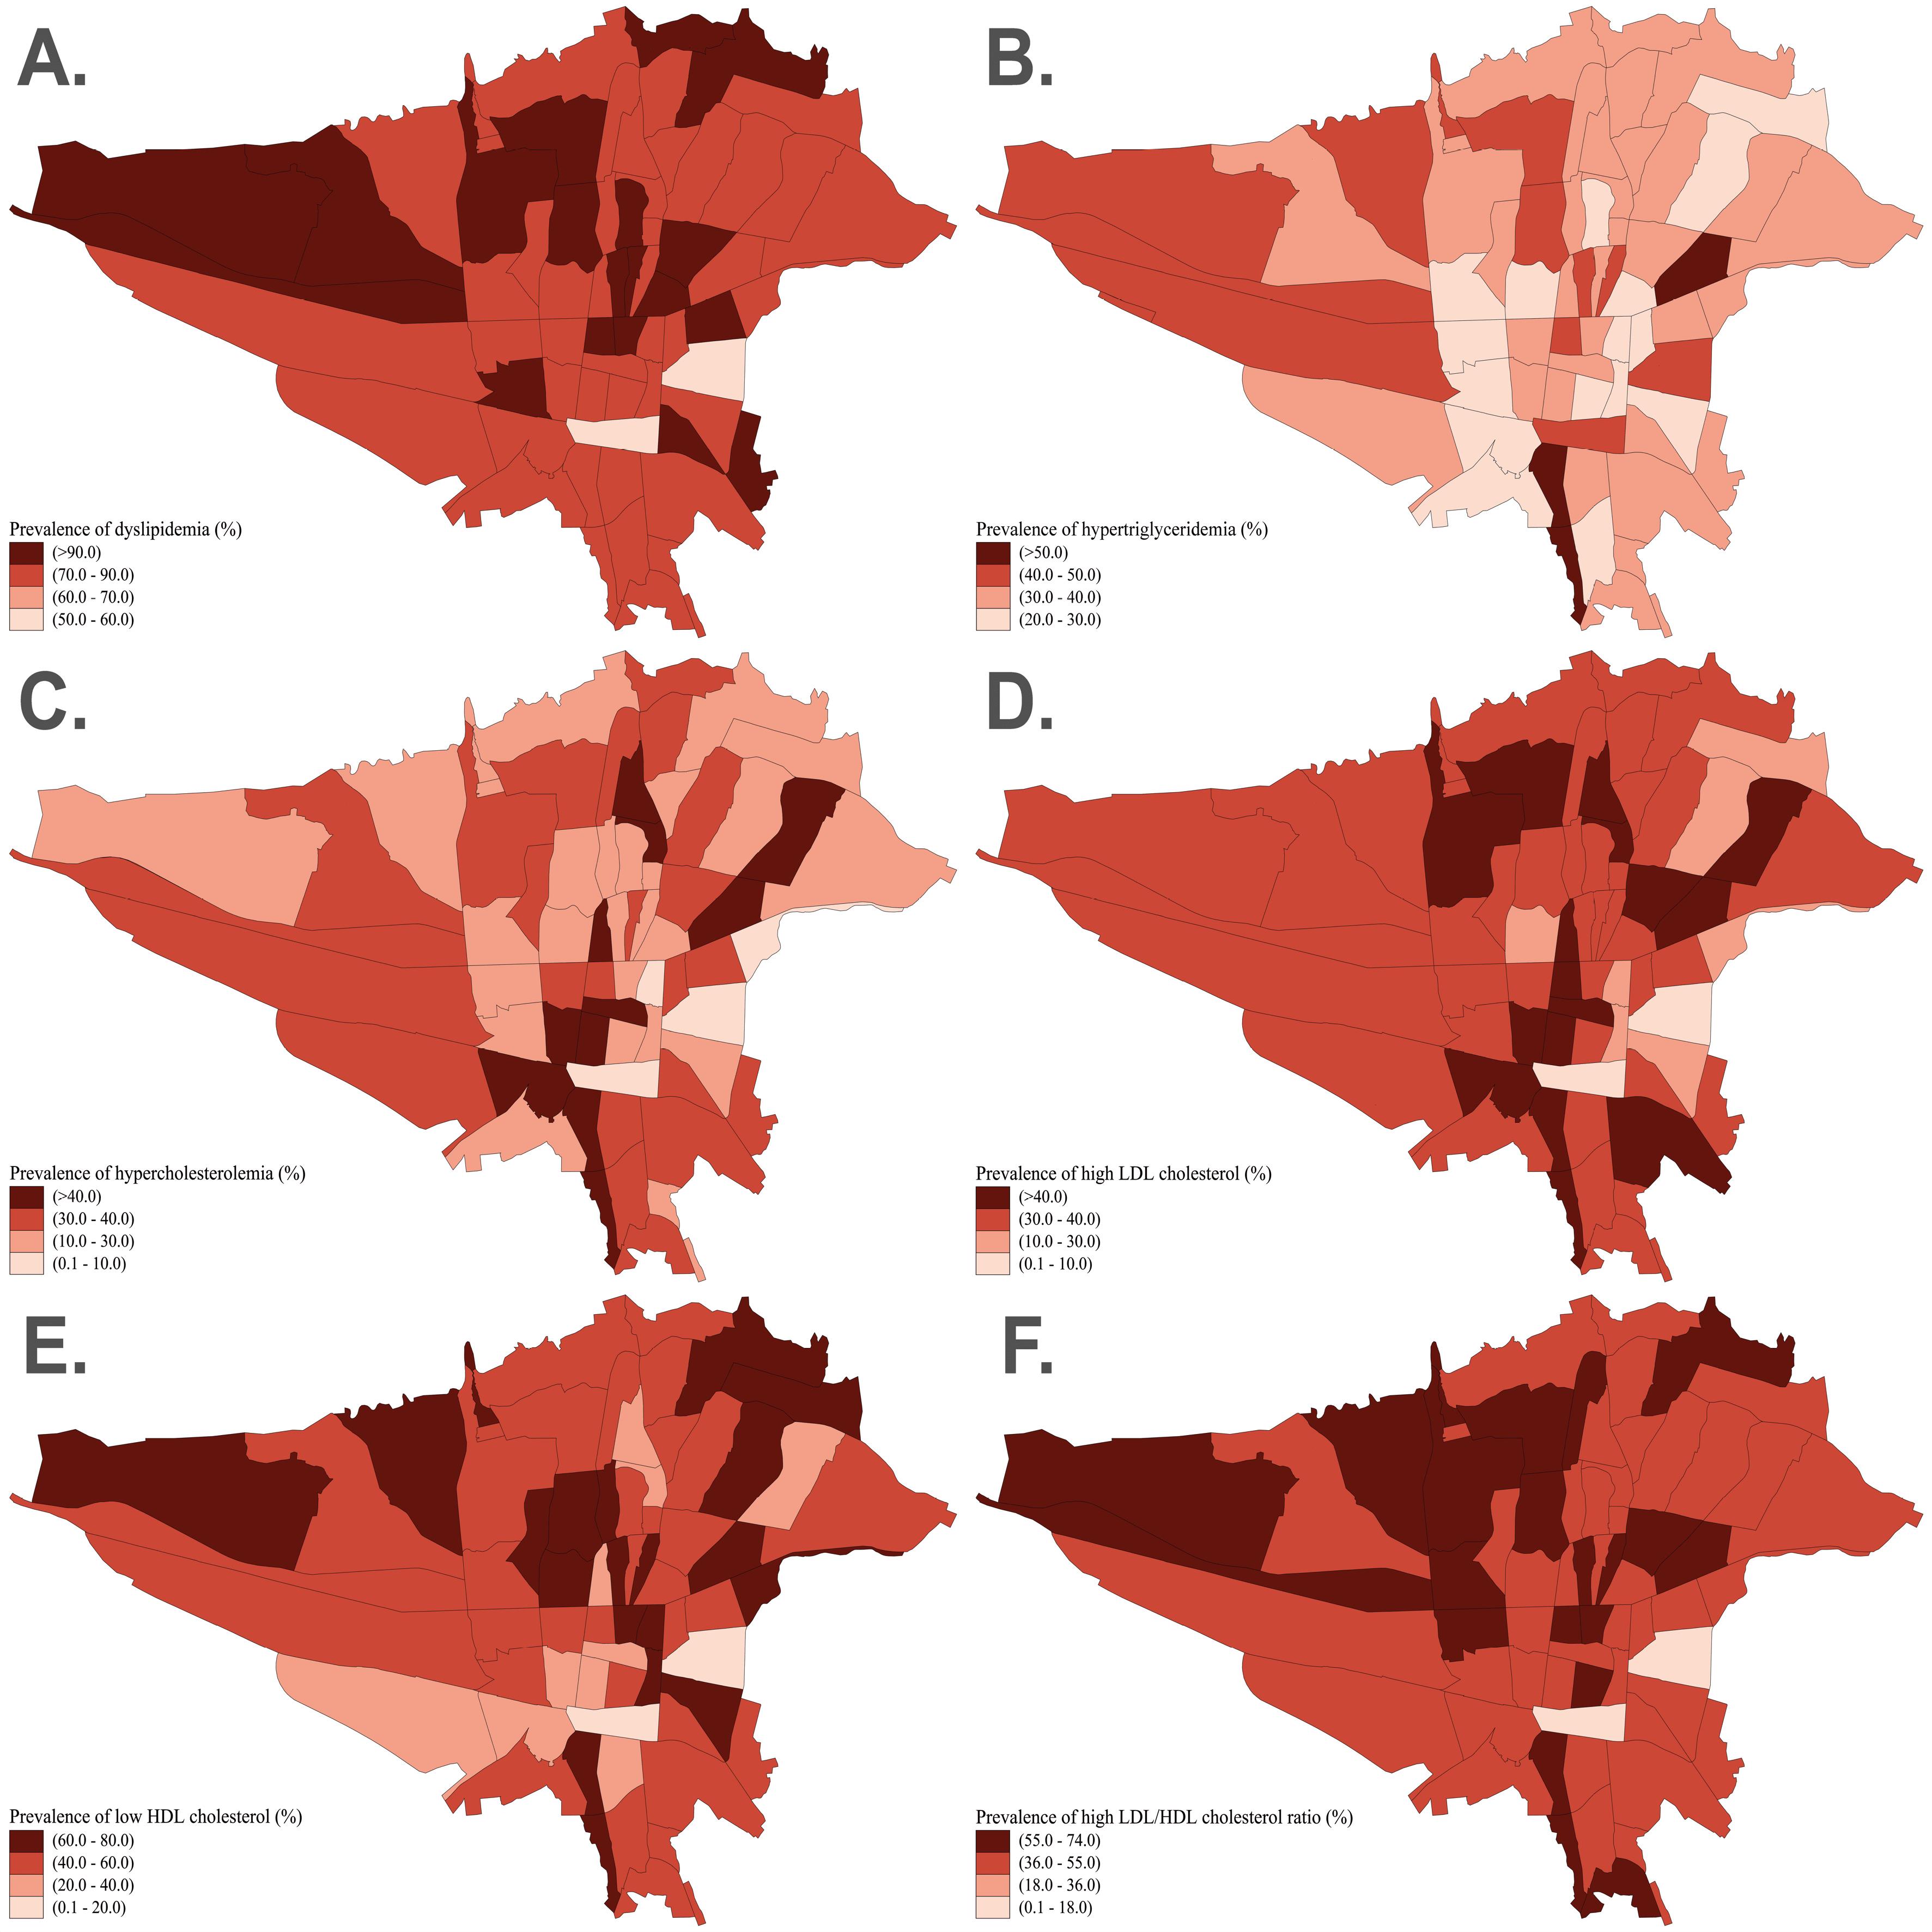
Figure 2.
Geographic distribution of dyslipidemia (A), hypertriglyceridemia (B), hypercholesterolemia (C), high LDL-C (D), low HDL-C (E), and high LDL/HDL ratio (F) based on the zip code districts of Tehran. HDL-C, high-density lipoprotein cholesterol; LDL-C, low-density lipoprotein cholesterol
.
Geographic distribution of dyslipidemia (A), hypertriglyceridemia (B), hypercholesterolemia (C), high LDL-C (D), low HDL-C (E), and high LDL/HDL ratio (F) based on the zip code districts of Tehran. HDL-C, high-density lipoprotein cholesterol; LDL-C, low-density lipoprotein cholesterol
Discussion
This study estimated the prevalence of dyslipidemia and its subgroups among the adult population of Tehran aged ≥ 35 years using the TeCS recruitment data. The age-sex standardized prevalence of dyslipidemia was 82.7%. We found low HDL-C as the most common lipid abnormality followed by hypertriglyceridemia, high LDL-C, and hypercholesterolemia, respectively. Moreover, more than half of the Tehran adult population was estimated to have a high LDL/HDL ratio.
The WHO STEPS national survey results in 2021 concluded that 81.0% of the Iranian population (aged ≥ 25 years) had dyslipidemia.8 Their finding indicated that low HDL-C (68.4%) was the most prevalent lipid abnormality, followed by hypertriglyceridemia (39.7%), hypercholesterolemia (21.2%), and high LDL-C (16.4%). Meanwhile, a meta-analysis of population-based studies from 1994 to 2015 estimated the prevalence of hypercholesterolemia at 42%, high LDL-C at 40%, and low HDL-C at 42%.9 A comparison among these studies, considering the same cut-offs, reveals a decreasing pattern in hypercholesterolemia and high LDL-C prevalence; however, there is an increasing trend in low HDL-C levels during the same period. The Tehran metropolis is the most populous city in Iran with great ethnic diversity, which has experienced rapid urbanization in the past decades.21 Therefore, Tehran has a higher prevalence of dyslipidemia which can be possibly attributed to air pollution, a sedentary lifestyle, and unhealthy dietary habits compared to less populated provinces such as Golestan (68.5%), Kerman (74.1%), Mazandaran (76.6%), and Semnan (76.8%).8 However, more studies are warranted to find evidence between the following risk factors and dyslipidemia.22,23 A previous study has demonstrated a favorable trend in reducing TC and non-HDL-C from 1999 to 2011 in Tehran; however, it was limited due to the small sample size and single-district sampling.24 Since then, no other study has evaluated the prevalence of dyslipidemia in Tehran, and its current net prevalence remains unknown. Therefore, our results could provide a better image of dyslipidemia prevalence and its changing patterns among the adult population of Tehran by the upcoming follow-up phases of TeCS.
Our results showed that one out of three adult residents of Tehran has hypertriglyceridemia, which is higher than the rest of the country.8,25 Nonetheless, the latest WHO STEPS survey showed a high prevalence of hypertriglyceridemia in men who live in Tehran, while the prevalence was higher in women who lived in other cities.8 Similarly, we have observed a significantly higher prevalence of hypertriglyceridemia in men; this difference has more than doubled in individuals aged 35-44 and decreased with advancing age. Previous studies have reported a steady trend in the prevalence of hypertriglyceridemia from 1999 to 2011 in Tehran, but now it has diminished by 9.6% since 2011, considering the same cut-off value.24-26 In addition, some risk factors, such as higher BMI, diabetes, hypertension, tobacco smoking, and alcohol consumption, were associated with an increased risk of hypertriglyceridemia.
This study indicated a significantly greater prevalence of hypercholesterolemia and high LDL-C among women than men, which is similar to findings from previous studies conducted in other provinces in Iran.8,9 Moreover, hypercholesterolemia and high LDL-C prevalence increased in the middle-aged, peaked among individuals aged 55-64 years, and decreased afterward with the same pattern in both genders. Previous studies have reported similar levels of TC and LDL-C between men and women during the first two decades of life, with a trend of increase in both sexes with advancing age.18,25 Of note, women experienced a steeper rise in TC and LDL-C levels compared to men. One explanation can be lower estrogen levels in women over 50 years, leading to increased lipid abnormalities after menopause.27 We observed an increasing pattern regarding the prevalence of hypercholesterolemia and high LDL-C with aging, which peaks in the ‘55-64’ age group. It emphasizes that during the fourth and fifth decades of life, individuals are at greater risk for developing hypercholesterolemia and high LDL-C by aging. Thus, implementing public health strategies to increase health literacy and developing screening programs can help minimize the burden of CVDs, especially in this age group.28
After evaluating the geographical distribution of lipid parameters, we observed a higher prevalence of dyslipidemia, low HDL-C, and high LDL/HDL ratio in the northern regions of Tehran (traditionally known as higher socio-economic status region), while hypercholesterolemia and high LDL-C were more prevalent in the southern regions. We hypothesize that these patterns may be attributed to higher socio-economic status and more sedentary lifestyles in the northern districts, and to greater air pollution exposure and unhealthy dietary habits in the southern regions of Tehran.7,17 Nevertheless, these associations warrant further socio-economic studies to elucidate the underlying factors contributing to the observed geographical disparities in lipid profiles.
The current age-sex standardized prevalence of hypercholesterolemia and high LDL-C in Tehran was lower than in many countries, such as the United States, China, Poland, and Turkey, using the same cut-off values.29-32 We believe that differences in lifestyles, dietary habits, genetic factors, and time of studies can cause this heterogeneity among different societies. Nevertheless, there was a 12.1% and 17.5% reduction in mean TC and LDL-C levels since 2011.24 National policies established in 2000 may have contributed to this favorable trend. These policies restricted using trans fatty acids in all oil products and tried to raise public awareness regarding the risks of dietary intake of saturated fats.33 Besides, the observed decrease in dyslipidemia may have been explained not only by positive lifestyle changes but also by the increased utilization of lipid-lowering medications.34 Nevertheless, we must emphasize that high LDL-C was still related to 16.1% (95% uncertainty interval (UI): 12.2%–20.5%) of deaths and 7.8% (95% UI: 6.2–9.7) of disability-adjusted life years of non-communicable diseases in 2019 among the Iranian population.1
The high prevalence of dyslipidemia was mainly attributed to the high prevalence of low HDL-C among residents of Tehran, which is one of the highest reported values worldwide.29-32 We observed that women were more prone to have low HDL-C, but during the fourth and fifth decades of life, low HDL-C was more prevalent in men. According to global physical activity reports, Iran suffers from a high prevalence of inappropriate physical activity.35 Similarly, we noticed a greater prevalence of low HDL-C in those with considerably inadequate physical activity within the adult population. Iranians’ dietary habits, which are high in carbohydrates, may also contribute to HDL-C abnormality. Replacing saturated fatty acids with carbohydrates was associated with no change in TC and LDL-C levels but also an unfavorable decrease in HDL-C and an increase in triglyceride.36 On the other hand, the prohibition of alcohol use and its low prevalence in society may be another reason for the high prevalence of low HDL-C in Tehran. It should be noted that the real estimation of alcohol consumption could be different from the values reported in this study, as there is a lack of information or underreporting by patients who know that alcohol consumption is prohibited.
New evidence suggests the LDL-C/HDL-C ratio as a novel marker associated with coronary atherosclerosis progression, myocardial infarction, and even adverse outcomes within one year in patients undergoing coronary angioplasty.37,38 It was proposed as a significant predictor for coronary atherosclerotic heart disease, as it takes into account both LDL-C and HDL-C levels simultaneously, with 64.5% sensitivity and 61.3% specificity for a cut-off value of > 2.5.19 We observed a significant prevalence of a high LDL-C/HDL-C ratio (52.5%), with a 20% higher prevalence among men than women. This between-gender difference was more significant among the ‘35-44’ and ‘45-54’ age groups and decreased with aging. We must highlight that the prevalence of high LDL-C/HDL-C was more than 1.5 times higher in men aged 35-44 compared to women.
Despite several strengths of this study, including its comprehensive, randomized sample size that investigated the prevalence of dyslipidemia and lipid abnormalities across all geographical districts of Tehran, it has some limitations. First, it is a cross-sectional study, which inherits certain biases. Second, the study’s enrollment was limited to individuals aged 35 years and above in TeCS, limiting the representativeness of our results for the general population due to the absence of data on younger individuals. Third, although standardized procedures were employed for lipid measurements, the inherent biological variability and reliance on self-reported data could potentially introduce measurement and information biases. Efforts were made to minimize these through validated methodologies and the cross-checking of medical records. Fourth, despite adjusting for known confounders such as lifestyle factors and comorbidities, residual confounding by unmeasured or unknown factors cannot be entirely ruled out. Acknowledging these limitations is crucial when interpreting the results, as it emphasizes the need for further research employing diverse designs to more comprehensively explore dyslipidemia.
Conclusion
We found that four out of five adult residents (aged ≥ 35 years) of Tehran have dyslipidemia, with low HDL-C being the most prevalent lipid abnormality. In addition, a high LDL/HDL ratio was observed in more than half of the study population. This dyslipidemia profiling on a large-scale random sample from Tehran provides valuable insights for healthcare policymakers aiming to develop and implement comprehensive preventative measures to decrease the incidence of dyslipidemia-related morbidity and mortality. Additionally, it is crucial to focus future research on high-risk populations to assess the efficacy of various prevention and treatment programs in improving health literacy, promoting medication adherence, and encouraging healthy lifestyle behaviors.
Supplementary Files
Supplementary file 1 contains Table S1.
(pdf)
Acknowledgements
The authors would like to thank all the participants of the Tehran Cohort Study for their cooperation. We also acknowledge all the dedicated staff and health workers of Tehran Heart Center who were involved in this study.
Competing Interests
The authors have no competing interests to declare.
Data Availability Statement
The data underlying this article will be shared on reasonable request to the corresponding author.
Ethical Approval
The protocol of the TeCS was approved by the research board of Tehran Heart Center and the ethics committee of the Tehran University of Medical Sciences (IR.TUMS.MEDICINE.REC.1399.074). This study follows the recommendations of the 2013 Helsinki Declaration and its updates. All participants provided written informed consent upon enrollment, data collection, and obtaining biological samples, which covered aspects of confidentiality and their right to withdraw from the study at any point without consequence.
Funding
This study was supported by a grant from the Iranian Ministry of Health (Grant number: 1296006, Program: 1603003000) and Tehran Heart Center (Internal fund).
References
- Roth GA, Mensah GA, Johnson CO, Addolorato G, Ammirati E, Baddour LM. Global burden of cardiovascular diseases and risk factors, 1990-2019: update from the GBD 2019 study. J Am Coll Cardiol 2020; 76(25):2982-3021. doi: 10.1016/j.jacc.2020.11.010 [Crossref] [ Google Scholar]
- Azadnajafabad S, Mohammadi E, Aminorroaya A, Fattahi N, Rezaei S, Haghshenas R, et al. Non-communicable diseases’ risk factors in Iran; a review of the present status and action plans. J Diabetes Metab Disord. 2021:1-9. 10.1007/s40200-020-00709-8.
- Barter P. Lessons learned from the Investigation of Lipid Level Management to Understand its Impact in Atherosclerotic Events (ILLUMINATE) trial. Am J Cardiol 2009; 104(10 Suppl):10E-5E. doi: 10.1016/j.amjcard.2009.09.014 [Crossref] [ Google Scholar]
- Tietge UJ. Hyperlipidemia and cardiovascular disease: inflammation, dyslipidemia, and atherosclerosis. Curr Opin Lipidol 2014; 25(1):94-5. doi: 10.1097/mol.0000000000000051 [Crossref] [ Google Scholar]
- Angassa D, Solomon S, Seid A. Factors associated with dyslipidemia and its prevalence among Awash wine factory employees, Addis Ababa, Ethiopia: a cross-sectional study. BMC Cardiovasc Disord 2022; 22(1):22. doi: 10.1186/s12872-022-02465-4 [Crossref] [ Google Scholar]
- Turk-Adawi K, Sarrafzadegan N, Fadhil I, Taubert K, Sadeghi M, Wenger NK. Cardiovascular disease in the Eastern Mediterranean region: epidemiology and risk factor burden. Nat Rev Cardiol 2018; 15(2):106-19. doi: 10.1038/nrcardio.2017.138 [Crossref] [ Google Scholar]
- Oraii A, Shafiee A, Jalali A, Alaeddini F, Saadat S, Masoudkabir F. Prevalence, awareness, treatment, and control of type 2 diabetes mellitus among the adult residents of Tehran: Tehran Cohort Study. BMC Endocr Disord 2022; 22(1):248. doi: 10.1186/s12902-022-01161-w [Crossref] [ Google Scholar]
- Khanali J, Ghasemi E, Rashidi MM, Ahmadi N, Ghamari SH, Azangou-Khyavy M. Prevalence of plasma lipid abnormalities and associated risk factors among Iranian adults based on the findings from STEPs survey 2021. Sci Rep 2023; 13(1):15499. doi: 10.1038/s41598-023-42341-5 [Crossref] [ Google Scholar]
- Akbartabar Toori M, Kiani F, Sayehmiri F, Sayehmiri K, Mohsenzadeh Y, Ostovar R. Prevalence of hypercholesterolemia, high LDL, and low HDL in Iran: a systematic review and meta-analysis. Iran J Med Sci 2018; 43(5):449-65. [ Google Scholar]
- Najafipour H, Yousefzadeh G, Baneshi MR, Ahmadi Gohari M, Shahouzehi B, Shadkam Farokhi M. Prevalence and 5-year incidence rate of dyslipidemia and its association with other coronary artery disease risk factors in Iran: results of the Kerman coronary artery disease risk factors study (Phase 2). J Res Med Sci 2021; 26:99. doi: 10.4103/jrms.JRMS_748_20 [Crossref] [ Google Scholar]
- Hedayatnia M, Asadi Z, Zare-Feyzabadi R, Yaghooti-Khorasani M, Ghazizadeh H, Ghaffarian-Zirak R. Dyslipidemia and cardiovascular disease risk among the MASHAD study population. Lipids Health Dis 2020; 19(1):42. doi: 10.1186/s12944-020-01204-y [Crossref] [ Google Scholar]
- Azizi F, Rahmani M, Ghanbarian A, Emami H, Salehi P, Mirmiran P. Serum lipid levels in an Iranian adults population: Tehran Lipid and Glucose Study. Eur J Epidemiol 2003; 18(4):311-9. doi: 10.1023/a:1023606524944 [Crossref] [ Google Scholar]
- Saghafi H, Mahmoodi MJ, Fakhrzadeh H, Heshmat R, Shafaee A, Larijani B. Cardiovascular risk factors in first-degree relatives of patients with premature coronary artery disease. Acta Cardiol 2006; 61(6):607-13. doi: 10.2143/ac.61.6.2017959 [Crossref] [ Google Scholar]
- Veghari G, Joshaghani H, Hoseini S, Sedaghat S, Nik Nezhad F, Angizeh A, et al. The study of prevalence of hypercholesterolemia and some relative factors in Golestan province. Payavard Salamat 2010;3(3):10-24. [Persian].
- Shafiee A, Saadat S, Shahmansouri N, Jalali A, Alaeddini F, Haddadi M. Tehran cohort study (TeCS) on cardiovascular diseases, injury, and mental health: design, methods, and recruitment data. Glob Epidemiol 2021; 3:100051. doi: 10.1016/j.gloepi.2021.100051 [Crossref] [ Google Scholar]
- World Health Organization. Standard STEPS Instrument. 2020. Available from: https://www.who.int/publications/m/item/standard-steps-instrument. Accessed October 2020.
- Oraii A, Shafiee A, Jalali A, Alaeddini F, Saadat S, Sadeghian S. Prevalence, awareness, treatment, and control of hypertension among adult residents of Tehran: the Tehran Cohort Study. Glob Heart 2022; 17(1):31. doi: 10.5334/gh.1120 [Crossref] [ Google Scholar]
- Third Report of the National Cholesterol Education Program (NCEP) Expert Panel on Detection, Evaluation, and Treatment of High Blood Cholesterol in Adults (Adult Treatment Panel III) final report. Circulation 2002;106(25):3143-421.
- Sun T, Chen M, Shen H, PingYin PingYin, Fan L, Chen X. Predictive value of LDL/HDL ratio in coronary atherosclerotic heart disease. BMC Cardiovasc Disord 2022; 22(1):273. doi: 10.1186/s12872-022-02706-6 [Crossref] [ Google Scholar]
- Williams B, Mancia G, Spiering W, Agabiti Rosei E, Azizi M, Burnier M. 2018 ESC/ESH Guidelines for the management of arterial hypertension. Eur Heart J 2018; 39(33):3021-104. doi: 10.1093/eurheartj/ehy339 [Crossref] [ Google Scholar]
- Pilehvar AA. Spatial-geographical analysis of urbanization in Iran. Humanit Soc Sci Commun 2021; 8(1):63. doi: 10.1057/s41599-021-00741-w [Crossref] [ Google Scholar]
- Lazo-Porras M, Bernabe-Ortiz A, Quispe R, Málaga G, Smeeth L, Gilman RH, et al. Urbanization, mainly rurality, but not altitude is associated with dyslipidemia profiles. J Clin Lipidol 2017;11(5):1212-22.e4. 10.1016/j.jacl.2017.06.016.
- Opoku S, Gan Y, Fu W, Chen D, Addo-Yobo E, Trofimovitch D. Prevalence and risk factors for dyslipidemia among adults in rural and urban China: findings from the China National Stroke Screening and prevention project (CNSSPP). BMC Public Health 2019; 19(1):1500. doi: 10.1186/s12889-019-7827-5 [Crossref] [ Google Scholar]
- Baghbani-Oskouei A, Tohidi M, Asgari S, Ramezankhani A, Azizi F, Hadaegh F. Serum lipids during 20 years in the Tehran Lipid and Glucose Study: prevalence, trends and impact on non-communicable diseases. Int J Endocrinol Metab 2018; 16(4 Suppl):e84750. doi: 10.5812/ijem.84750 [Crossref] [ Google Scholar]
- Tabatabaei-Malazy O, Qorbani M, Samavat T, Sharifi F, Larijani B, Fakhrzadeh H. Prevalence of dyslipidemia in Iran: a systematic review and meta-analysis study. Int J Prev Med 2014; 5(4):373-93. [ Google Scholar]
- Azizi F, Salehi P, Etemadi A, Zahedi-Asl S. Prevalence of metabolic syndrome in an urban population: Tehran Lipid and Glucose Study. Diabetes Res Clin Pract 2003; 61(1):29-37. doi: 10.1016/s0168-8227(03)00066-4 [Crossref] [ Google Scholar]
- Torosyan N, Visrodia P, Torbati T, Minissian MB, Shufelt CL. Dyslipidemia in midlife women: approach and considerations during the menopausal transition. Maturitas 2022; 166:14-20. doi: 10.1016/j.maturitas.2022.08.001 [Crossref] [ Google Scholar]
- Azadnajafabad S, Karimian M, Roshani S, Rezaei N, Mohammadi E, Saeedi Moghaddam S. Population attributable fraction estimates of cardiovascular diseases in different levels of plasma total cholesterol in a large-scale cross-sectional study: a focus on prevention strategies and treatment coverage. J Diabetes Metab Disord 2020; 19(2):1453-63. doi: 10.1007/s40200-020-00673-3 [Crossref] [ Google Scholar]
- Tsao CW, Aday AW, Almarzooq ZI, Alonso A, Beaton AZ, Bittencourt MS. Heart disease and stroke statistics-2022 update: a report from the American Heart Association. Circulation 2022; 145(8):e153-639. doi: 10.1161/cir.0000000000001052 [Crossref] [ Google Scholar]
- Lin CF, Chang YH, Chien SC, Lin YH, Yeh HY. Epidemiology of dyslipidemia in the Asia Pacific region. Int J Gerontol 2018; 12(1):2-6. doi: 10.1016/j.ijge.2018.02.010 [Crossref] [ Google Scholar]
- Zdrojewski T, Solnica B, Cybulska B, Bandosz P, Rutkowski M, Stokwiszewski J. Prevalence of lipid abnormalities in Poland The NATPOL 2011 survey. Kardiol Pol 2016; 74(3):213-23. doi: 10.5603/kp.2016.0029 [Crossref] [ Google Scholar]
- Bayram F, Kocer D, Gundogan K, Kaya A, Demir O, Coskun R. Prevalence of dyslipidemia and associated risk factors in Turkish adults. J Clin Lipidol 2014; 8(2):206-16. doi: 10.1016/j.jacl.2013.12.011 [Crossref] [ Google Scholar]
- Peymani P, Joulaie H, Zamiri N, Ahmadi SM, Dinarvand R, Hosseini H. Iran’s experience on reduction of trans-fatty acid content in edible oils. Middle East J Sci Res 2012; 11(9):1207-11. doi: 10.5829/idosi.mejsr.2012.11.09.64197 [Crossref] [ Google Scholar]
- Carroll MD, Lacher DA, Sorlie PD, Cleeman JI, Gordon DJ, Wolz M. Trends in serum lipids and lipoproteins of adults, 1960-2002. JAMA 2005; 294(14):1773-81. doi: 10.1001/jama.294.14.1773 [Crossref] [ Google Scholar]
- Hallal PC, Andersen LB, Bull FC, Guthold R, Haskell W, Ekelund U. Global physical activity levels: surveillance progress, pitfalls, and prospects. Lancet 2012; 380(9838):247-57. doi: 10.1016/s0140-6736(12)60646-1 [Crossref] [ Google Scholar]
- Mente A, Dehghan M, Rangarajan S, McQueen M, Dagenais G, Wielgosz A. Association of dietary nutrients with blood lipids and blood pressure in 18 countries: a cross-sectional analysis from the PURE study. Lancet Diabetes Endocrinol 2017; 5(10):774-87. doi: 10.1016/s2213-8587(17)30283-8 [Crossref] [ Google Scholar]
- Zhong Z, Hou J, Zhang Q, Zhong W, Li B, Li C. Assessment of the LDL-C/HDL-C ratio as a predictor of one-year clinical outcomes in patients with acute coronary syndromes after percutaneous coronary intervention and drug-eluting stent implantation. Lipids Health Dis 2019; 18(1):40. doi: 10.1186/s12944-019-0979-6 [Crossref] [ Google Scholar]
- Nicholls SJ, Tuzcu EM, Sipahi I, Grasso AW, Schoenhagen P, Hu T. Statins, high-density lipoprotein cholesterol, and regression of coronary atherosclerosis. Jama 2007; 297(5):499-508. doi: 10.1001/jama.297.5.499 [Crossref] [ Google Scholar]