Arch Iran Med. 25(12):767-778.
doi: 10.34172/aim.2022.122
Original Article
Neonate, Infant, and Child Mortality in North Africa and Middle East by Cause: An Analysis for the Global Burden of Disease Study 2019
Sadaf G. Sepanlou Conceptualization, Formal analysis, Methodology, Supervision, Writing – original draft, Writing – review & editing, 1 
Hossein Rezaei Aliabadi Formal analysis, Methodology, Visualization, Writing – review & editing, 2
Reza Malekzadeh Supervision, Writing – review & editing, 1, *
Mohsen Naghavi Conceptualization, Supervision, Writing – review & editing, 3, * #
Author information:
1Digestive Disease Research Institute, Tehran University of Medical Sciences, Tehran, Iran
2Bam University of Medical Sciences, Bam, Iran
3Institute for Health Metrics and Evaluation, School of Medicine, University of Washington, Seattle, USA
#A full list of authors is provided at the end of the paper
Abstract
Background:
During the past three decades, neonate, infant, and child mortality declined in North Africa and Middle East. However, there is substantial heterogeneity in mortality rates across countries.
Methods:
This study is part of the Global Burden of Diseases study (GBD) 2019. We report the number as well as mortality rates for neonates, infants, and children by cause across 21 countries in the region since 1990.
Results:
Between 1990 and 2019, the neonate mortality rate in the region declined from 31.9 (29.8, 34.0) to 12.2 (11.1, 13.3) per 1000 live births. Respective figures for under 5 mortality rates (U5MRs) were 79.1 (75.7, 82.7) in 1990 and 24.4 (22.3, 26.7) per 1000 live births in 2019. The majority of deaths among children under 5 years were due to under 1 year deaths: 75.9% in 1990 and 81.8% in 2019. Mortality rates in males were higher than females. The mortality rate among neonates ranged from 2.4 (2.1, 2.6) per 1000 live births in Bahrain to 25.0 (21.6, 28.4) in Afghanistan in 2019. Similarly, in 2019, the U5MR ranged from 5.0 (4.2–6.0) per 1000 live births in United Arab Emirates to 55.3 (47.9–63.5) in Afghanistan. Neonatal disorders, congenital birth defects, and lower respiratory infections were the three main causes of neonate, infant, and child mortality in almost all countries in the region.
Conclusion:
In 2019, most countries in this region have achieved the SDG targets for neonate and child mortality. However, there is still substantial heterogeneity across countries.
Keywords: Child mortality, Inequality, Infant mortality, Middle East, North Africa
Copyright and License Information
© 2022 The Author(s).
This is an open-access article distributed under the terms of the Creative Commons Attribution License (
https://creativecommons.org/licenses/by/4.0), which permits unrestricted use, distribution, and reproduction in any medium, provided the original work is properly cited.
Cite this article as: Sepanlou SG, Rezaei Aliabadi H, Malekzadeh R, Naghavi M. Neonate, infant, and child mortality in North Africa and Middle East by cause: An analysis for the global burden of disease study 2019. Arch Iran Med. 2022;25(12):767-778. doi: 10.34172/aim.2022.122
Introduction
During the past three decades, the world witnessed substantial reduction in neonate, infant, and child mortality. The global number of deaths among children under 5 years old decreased by 58%, from 12 million in 1990 to slightly over 5 million in 2019. Under 5 mortality rate (U5MR) declined from 87 per 1000 live births in 1990 to 37 per 1000 live births in 2019.1,2 However, the decline hasn’t been homogenous across regions and nations with various levels of socioeconomic development, and the existing disparity is not negligible.3,4 In 2019, more than half of the global deaths among children under 5 years old occurred in low-income countries, while high-income nations accounted for merely 4 percent of total deaths.1-3,5-7 If this trend continues, many low-income nations will be unable to achieve the targets set out in the sustainable development goals (SDGs) for neonate and child mortality by 2030.8,9
Similar trend in neonate, infant, and child mortality and the accompanying heterogeneity is observed in North Africa and Middle East. This region is unique in many ways. Islam is the prominent religion, and the region is comprised of 21 countries that substantially vary in their socioeconomic development and the infrastructure of their health systems. Ultimately, the region is afflicted by ongoing conflicts, and political, economic, and social turmoil that affects the health of vulnerable groups, mainly mothers, neonates, infants, and children.10 In spite of the progress in children’s health during the past 30 years, there are still substantial disparities between countries in the region. In this paper we present the burden of neonate, infant, and child mortality by cause in North Africa and Middle East 1990 to 2019.
Materials and Methods
This study is part of GBD 2019, which was a systematic effort to estimate the levels, trends, and causes of mortality by sex, age, year (1990 to 2019), and location. In this article we report the estimates for neonate (0-27 days), infant (under 1 year), and child (under 5 year) mortality by cause at the regional and national levels in north Africa and Middle East and across 21 countries in this region including: Afghanistan, Algeria, Bahrain, Egypt, Iran, Iraq, Jordan, Kuwait, Lebanon, Libya, Morocco, Oman, Palestine, Qatar, Saudi Arabia, Sudan, Syrian Arab Republic, Tunisia, Turkey, United Arab Emirates, and Yemen.
All-Cause Mortality
We used multiple data types to estimate all-cause mortality rate, including data from vital registration system, and surveys and censuses, from which we extracted household death recall data, summary birth histories, and complete birth histories.
First, the ratio of children ever surviving to children ever born by age of mother was converted to an estimate of U5MR. Second, a multi-stage process was used to include a non-linear mixed effects model, source bias correction, spatiotemporal smoothing, and Gaussian process regression to synthesize U5MR data into both sex U5MR estimates for every location-year in North Africa and Middle East. Complete time series of lag-distributed income, maternal education (mean years of education among women of reproductive age, 15–49 years), and childhood HIV crude were incorporated into the mixed effects model. Third, analogous multi-stage location-year specific models were used to estimate the sex-ratio of under-5 mortality and age- and sex specific probability of death for neonates and infants. Fourth, death counts were calculated by simulating exposure to the estimated age-specific mortality probabilities for weekly birth cohorts from GBD 2019 live birth estimates. Fifth, death counts were divided by corresponding age-specific mortality rates (deaths per person-year) which is the version of the mortality metric presented in most GBD publications and visualization tools. Finally, fatal discontinuities, defined as sharp change in mortality by year resulting from unexpected events such as natural disasters and conflict, were estimated separately and appended to generate final all-cause mortality estimates.11
Cause-Specific Mortality
For calculating cause specific mortality, cause of death data from above mentioned data sources were in the first step mapped to the GBD cause list using various revisions of the International Classification of Diseases and Injuries.1 Second, data was corrected for misclassification to non-specific codes, impossible causes, or clinical syndromes by redistributing these so-called “garbage codes” to the most likely underlying causes of death by age, sex, location, and year using a number of previously described statistical approaches.1,11 Third, a non-zero floor was calculated defined as + /- 2 median absolute deviations for each age-sex-cause combination to reduce downward bias that could be introduced by redistribution for comparatively rare causes in locations with good data quality. Fourth, a Bayesian noise-reduction algorithm was applied based on a Poisson count model to account for stochastic variation in data and reduce the upward bias that could be introduced by zero counts.1,11
After completion of data processing, a complete time series of mortality estimates was generated for each cause. Cause of Death Ensemble modeling (CODEm) was the most commonly-used modeling platform. CODEm uses a train-test-test approach to evaluate multiple submodels, each of which contain different combinations of candidate covariates, to systematically maximize out of sample predictive validity and weight them accordingly in generating a final ensemble model.12 Cause-specific mortality estimates were then scaled to match all-cause mortality estimates for each age group, location, sex, and year in a process called CoDCorrect.1 Similar to the all-cause mortality analysis above, cause-specific deaths due to fatal discontinuities (eg, conflict and terrorism, major transportation accidents, natural disasters, epidemics, other forms of disaster such as large fires or the collapse of large buildings) were estimated separately using vital registration and alternative databases and appended to final results. Cause-specific mortality rates were converted into probabilities by multiplying all-cause probability of death by cause fraction.
Disparity in Mortality
We used the socio-demographic index (SDI) to determine the relationship between the development level of a country and infant and child mortality. SDI is a composite indicator of a country’s lag-distributed income per capita, average years of schooling among individuals over 15 years old, and the fertility rate in females under the age of 25 years.2
The methods we used for propagating uncertainty are the same as those used in previous GBD iterations.1,5 All all-cause and cause-specific mortality estimation components are based on 1000 draws, or simulations, by age, sex, location, and year. Point estimates were derived from the mean of the draws, and 95% uncertainty intervals (UIs) were calculated as the 2.5th and 97.5th percentiles of the draws.
Role of the Funding Source
The funders of this study had no role in study design, data collection, data analysis, data interpretation, or the writing of the report. The corresponding author had full access to the data in the study and final responsibility for the decision to submit for publication.
Results
In 1990, a total of 381 311 (95% UI: 346 099, 418 595) deaths occurred among neonates less than 28 days in north Africa and Middle East, which steadily decreased to 149 527 (128 847, 172 959) deaths in 2019. The rate of neonatal mortality decreased as well from 31.9 (29.8, 34,0) per 1000 live births in 1990 to 12.2 (11.1, 13.3) per 1000 live births in 2019 (Figure 1, Table 1).
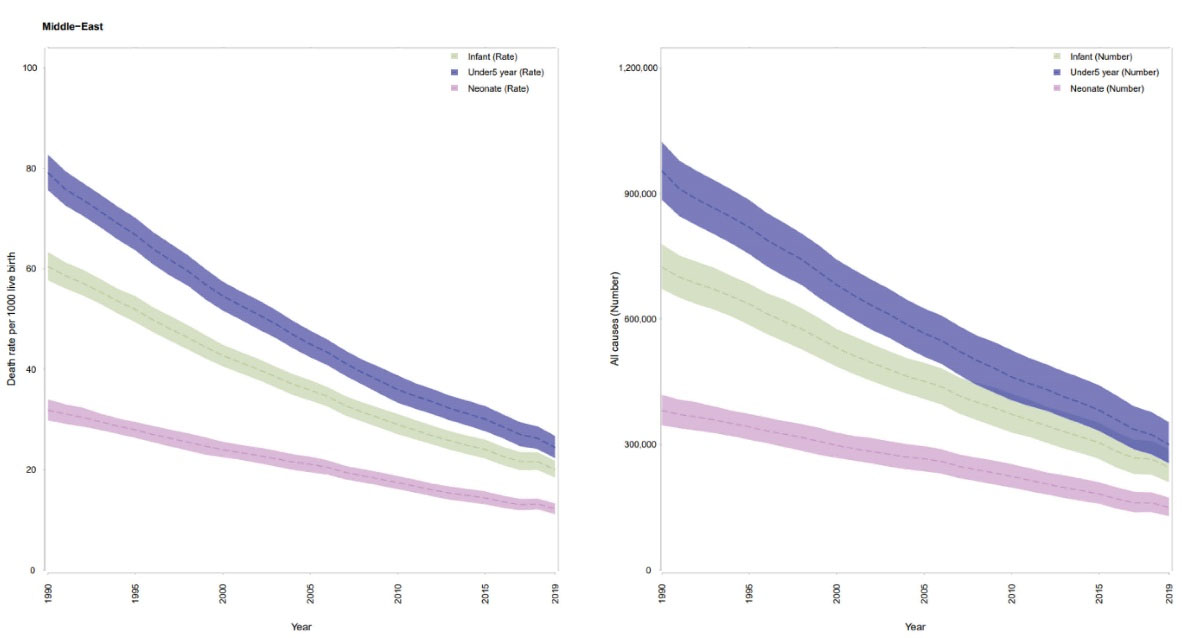
Figure 1.
The Trend in Neonate, Infant, and Child Mortality Counts and Rates at Regional Level From 1990 to 2019.
.
The Trend in Neonate, Infant, and Child Mortality Counts and Rates at Regional Level From 1990 to 2019.
Table 1.
Neonatal Deaths and Neonatal Mortality Per 1000 Live Births in 1990 and 2019 and the Percent Change in Mortality Rate from 1990 to 2019 by Country.
|
Location
|
Count 1990
|
Rate 1990
|
Count 2019
|
Rate 2019
|
Percent Change
|
| North Africa and Middle East |
381311 (346099, 418595) |
31.9 (29.8, 34) |
149527 (128847, 172959) |
12.2 (11.1, 13.3) |
-61.7 |
| Afghanistan |
25428 (21382, 29480) |
48.2 (40.8, 55.8) |
37406 (31255, 44206) |
25 (21.6, 28.4) |
-48.2 |
| Algeria |
19948 (16488, 23577) |
25.9 (22, 30) |
10651 (8216, 13410) |
12 (9.8, 14.5) |
-53.6 |
| Bahrain |
160 (138, 182) |
11.6 (10.4, 12.8) |
31 (25, 39) |
2.4 (2.1, 2.6) |
-79.7 |
| Egypt |
61991 (51399, 73280) |
31.7 (26.4, 36.9) |
11756 (8246, 16207) |
5.6 (4.2, 7.2) |
-82.5 |
| Iran (Islamic Republic of) |
55513 (46255, 65088) |
31.8 (28.1, 35.5) |
9145 (7444, 11136) |
6.8 (6.1, 7.4) |
-78.7 |
| Iraq |
19488 (17186, 21933) |
26.6 (23.6, 29.9) |
9132 (6614, 12751) |
9.5 (7.9, 11.5) |
-64.3 |
| Jordan |
2615 (2335, 2923) |
19 (17.3, 20.9) |
2127 (1565, 2932) |
8.8 (7.5, 10.6) |
-53.7 |
| Kuwait |
401 (362, 445) |
10.1 (9.2, 11) |
310 (242, 402) |
5.1 (4.3, 6) |
-49.6 |
| Lebanon |
2012 (1630, 2418) |
17.7 (15, 20.5) |
521 (373, 734) |
4.8 (4, 5.9) |
-72.8 |
| Libya |
3418 (2886, 3975) |
21.9 (19, 25.2) |
458 (351, 583) |
5.6 (4.7, 6.7) |
-74.3 |
| Morocco |
28496 (24391, 32923) |
35.3 (31.6, 38.9) |
6757 (5125, 8703) |
11.1 (9.7, 12.5) |
-68.7 |
| Oman |
1173 (965, 1428) |
17.7 (14.9, 21.1) |
418 (357, 482) |
5.4 (4.9, 5.9) |
-69.6 |
| Palestine |
1737 (1459, 2005) |
18.1 (15.6, 20.7) |
800 (606, 1061) |
6.4 (5.4, 7.6) |
-64.9 |
| Qatar |
146 (117, 177) |
13.8 (11.5, 16.2) |
113 (91, 144) |
4.2 (3.5, 5.1) |
-69.4 |
| Saudi Arabia |
9672 (7461, 12304) |
17.9 (14.3, 22) |
1202 (950, 1519) |
2.6 (2.2, 3.2) |
-85.3 |
| Sudan |
49396 (42516, 56378) |
46.9 (41.4, 52.3) |
25701 (20601, 32481) |
21.3 (18.9, 24.1) |
-54.6 |
| Syrian Arab Republic |
12436 (10059, 15136) |
24.1 (19.6, 29.1) |
1590 (1316, 1902) |
6.9 (5.7, 8.3) |
-71.4 |
| Tunisia |
5914 (4745, 7332) |
24.5 (20, 29.3) |
1144 (903, 1421) |
6.8 (5.7, 8.1) |
-72.2 |
| Turkey |
52158 (44638, 60983) |
30.9 (27, 35.2) |
8384 (6707, 10429) |
8.5 (7.2, 10.2) |
-72.4 |
| United Arab Emirates |
526 (443, 622) |
11.3 (9.8, 13) |
145 (109, 197) |
2.6 (2.2, 3.1) |
-77.2 |
| Yemen |
28427 (23995, 33380) |
41.7 (35.1, 49) |
21585 (17661, 26000) |
22.8 (18.8, 27.4) |
-45.3 |
In 1990, a total of 723 860 (672 030, 778 850) deaths occurred among infants under 1 year in north Africa and Middle East, which decreased to 245450 (209700, 288510) deaths in 2019. The rate of infant mortality decreased as well from 60.4 (57.7, 63.3) per 1000 live births in 1990 to 20 (18.4, 21.8) per 1000 live births in 2019 (Figure 1, Table 2).
Table 2.
Infant Deaths and Infant Mortality Per 1000 Live Births in 1990 and 2019 and the Percent Change in Mortality Rate from 1990 to 2019 by Country
|
Location
|
Count 1990
|
Rate 1990
|
Count 2019
|
Rate 2019
|
Percent Change
|
| North Africa and Middle East |
723859 (672030, 778848) |
60.4 (57.7, 63.3) |
245451 (209701, 288513) |
20 (18.4, 21.8) |
-66.9 |
| Afghanistan |
56358 (48541, 64039) |
107.8 (93.1, 122.3) |
67898 (58145, 78732) |
45.7 (40.8, 50.6) |
-57.7 |
| Algeria |
39149 (33860, 44986) |
50.8 (45.7, 56.1) |
15201 (12649, 18065) |
17.1 (15, 19.6) |
-66.2 |
| Bahrain |
279 (254, 305) |
20.3 (19.1, 21.5) |
69 (54, 86) |
5.2 (4.6, 5.9) |
-74.3 |
| Egypt |
122205 (108178, 137480) |
62.4 (55.6, 69.7) |
26026 (19484, 34243) |
12.3 (10.3, 14.7) |
-80.3 |
| Iran (Islamic Republic of) |
96630 (81362, 112155) |
54.9 (48.7, 61.3) |
12937 (10548, 15718) |
9.5 (8.6, 10.5) |
-82.6 |
| Iraq |
33694 (29756, 37685) |
45.9 (40.9, 51.2) |
11943 (8662, 16673) |
12.4 (10.4, 15.1) |
-72.9 |
| Jordan |
4061 (3630, 4535) |
29.6 (26.8, 32.9) |
3165 (2329, 4365) |
13.2 (11.2, 15.8) |
-55.5 |
| Kuwait |
634 (572, 703) |
15.6 (14.2, 17) |
469 (370, 605) |
7.7 (6.5, 9.1) |
-50.5 |
| Lebanon |
3133 (2692, 3606) |
27.5 (24.3, 31) |
842 (605, 1182) |
7.8 (6.5, 9.5) |
-71.8 |
| Libya |
5418 (4595, 6310) |
34.7 (29.8, 39.8) |
669 (514, 851) |
8.2 (6.9, 9.7) |
-76.4 |
| Morocco |
49731 (43578, 56329) |
61.7 (56.6, 66.6) |
9590 (6766, 13353) |
15.6 (13.1, 18.7) |
-74.7 |
| Oman |
1835 (1509, 2230) |
27.6 (23.4, 32.9) |
646 (550, 746) |
8.3 (7.5, 9.1) |
-70 |
| Palestine |
3069 (2755, 3412) |
32.2 (29.1, 35.7) |
1288 (974, 1711) |
10.2 (8.7, 12.3) |
-68.2 |
| Qatar |
235 (190, 285) |
22.1 (18.7, 25.9) |
178 (143, 227) |
6.7 (5.6, 8.1) |
-69.9 |
| Saudi Arabia |
18752 (14922, 22964) |
34.8 (29.2, 40.8) |
2031 (1608, 2561) |
4.5 (3.7, 5.5) |
-87.2 |
| Sudan |
91642 (82425, 101270) |
87.6 (79.8, 95.5) |
40090 (29616, 54405) |
33.1 (28.2, 39.4) |
-62.2 |
| Syrian Arab Republic |
21094 (18430, 23824) |
41 (36.2, 46.2) |
2194 (1738, 2744) |
9.5 (8.1, 11) |
-76.9 |
| Tunisia |
10334 (8882, 11968) |
42.6 (38.3, 47.5) |
1578 (1246, 1958) |
9.4 (7.9, 11.2) |
-78 |
| Turkey |
99030 (87611, 111003) |
58.6 (53.6, 64.3) |
12164 (9733, 15123) |
12.4 (10.4, 14.8) |
-78.9 |
| United Arab Emirates |
779 (666, 910) |
16.7 (14.7, 19.2) |
217 (163, 294) |
3.8 (3.2, 4.6) |
-77.3 |
| Yemen |
65310 (59386, 71936) |
96.5 (88.2, 105.6) |
36006 (29659, 43509) |
38.1 (32.5, 44.6) |
-60.5 |
Respective figures for under 5 mortality show similar decline. In 1990 a total of 954 160 (885 050, 1 023 530) deaths occurred among children under 5 years in north Africa and Middle East, which declined to 300 000 (255 260, 353 290) deaths in 2019. Respective figures for U5MRs were 79.1 (75.7, 82.7) in 1990 and 24.4 (22.3, 26.7) per 1000 live births in 2019 (Figure 1, Table 3). The majority of deaths among children under 5 years were due to under 1 year deaths: 75.9% in 1990 and 81.8% in 2019.
Table 3.
Child Deaths and Child Mortality Per 1000 Live Births in 1990 and 2019 and the Percent Change in Mortality Rate from 1990 to 2019 by Country
|
Location
|
Count 1990
|
Rate 1990
|
Count 2019
|
Rate 2019
|
Percent Change
|
| North Africa and Middle East |
954160 (885051, 1023528) |
79.1 (75.7, 82.7) |
300003 (255260, 353292) |
24.4 (22.3, 26.7) |
-69.2 |
| Afghanistan |
78170 (70157, 86995) |
151.1 (136.7, 167.4) |
81352 (67932, 97234) |
55.3 (47.9, 63.5) |
-63.4 |
| Algeria |
45891 (40132, 52202) |
59.5 (54.4, 65.1) |
17319 (14466, 20537) |
19.5 (17, 22.4) |
-67.2 |
| Bahrain |
316 (287, 345) |
23.1 (22, 24.3) |
87 (70, 109) |
6.5 (5.8, 7.4) |
-71.8 |
| Egypt |
164220 (148155, 181014) |
83.5 (76, 91.2) |
32602 (24627, 42641) |
15.3 (12.8, 18.3) |
-81.7 |
| Iran (Islamic Republic of) |
127608 (107686, 147945) |
71.2 (63.6, 79.1) |
15231 (12690, 18363) |
11.1 (10.2, 12) |
-84.4 |
| Iraq |
40246 (36130, 44178) |
54.7 (50.1, 59.8) |
15008 (11028, 20740) |
15.7 (13.2, 18.9) |
-71.4 |
| Jordan |
4604 (4125, 5109) |
33.7 (30.8, 37.1) |
3640 (2682, 5006) |
15.3 (13, 18.3) |
-54.7 |
| Kuwait |
890 (814, 970) |
21.2 (19.8, 22.5) |
555 (440, 708) |
9.2 (7.8, 10.8) |
-56.6 |
| Lebanon |
3606 (3085, 4170) |
31.8 (27.8, 36) |
983 (708, 1378) |
9 (7.5, 11) |
-71.7 |
| Libya |
6786 (5729, 7922) |
43.4 (37.7, 49.9) |
1109 (869, 1390) |
13.3 (11.3, 15.7) |
-69.3 |
| Morocco |
60435 (52488, 69442) |
75.1 (68.3, 81.9) |
11105 (7855, 15397) |
17.9 (15, 21.4) |
-76.1 |
| Oman |
2343 (1937, 2848) |
35.3 (30.1, 42) |
809 (690, 937) |
10.4 (9.4, 11.4) |
-70.6 |
| Palestine |
4016 (3642, 4435) |
43 (39.4, 47.2) |
1562 (1181, 2064) |
12.4 (10.5, 14.9) |
-71.2 |
| Qatar |
279 (225, 339) |
26.3 (22.1, 30.7) |
214 (172, 274) |
8 (6.7, 9.7) |
-69.5 |
| Saudi Arabia |
24026 (19470, 29118) |
44.9 (38.2, 52.2) |
2614 (2069, 3305) |
5.7 (4.8, 7) |
-87.2 |
| Sudan |
145281 (131797, 159313) |
142.2 (131.8, 153.7) |
50708 (37299, 68604) |
41.9 (35.7, 50) |
-70.5 |
| Syrian Arab Republic |
25521 (22218, 28925) |
49.9 (43.8, 56.3) |
3211 (2564, 3994) |
13.6 (11.7, 15.8) |
-72.8 |
| Tunisia |
12337 (10551, 14306) |
50.7 (45.6, 56.4) |
1923 (1526, 2380) |
11.3 (9.5, 13.5) |
-77.7 |
| Turkey |
118642 (104664, 134173) |
70.2 (63.9, 77.1) |
15133 (12148, 18731) |
15.4 (12.9, 18.4) |
-78.1 |
| United Arab Emirates |
1004 (868, 1158) |
21.6 (19.2, 24.3) |
295 (220, 399) |
5 (4.2, 6) |
-77 |
| Yemen |
87296 (79858, 94993) |
130.6 (120.4, 140.9) |
44236 (36660, 53124) |
46.7 (40.2, 54.4) |
-64.2 |
Figure 2 demonstrates that neonatal, infant, and child mortality rates were higher in males than females in all years from 1990 to 2019 in North Africa and Middle East. The same pattern was observed in all countries.
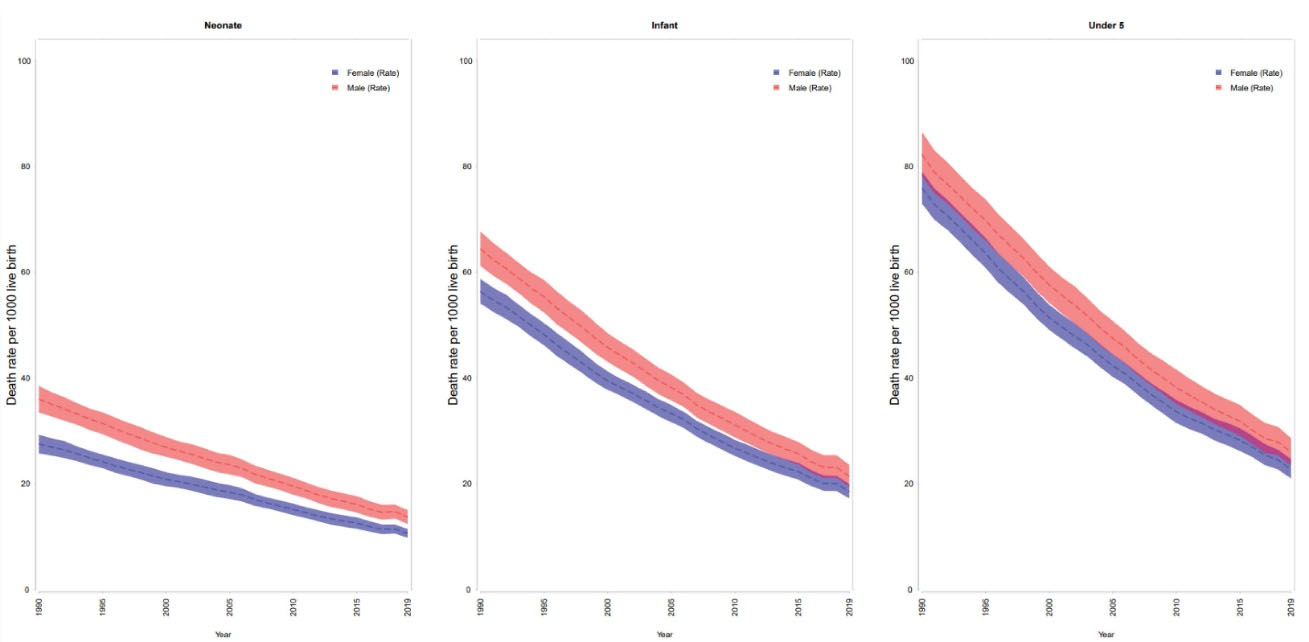
Figure 2.
Neonatal, infant, and child mortality rates by sex in north Africa and Middle East from 1990 to 2019.
.
Neonatal, infant, and child mortality rates by sex in north Africa and Middle East from 1990 to 2019.
The mortality rate among neonates ranged from 2.4 (2.1, 2.6) per 1000 live births in Bahrain to 21.3 (18.9, 24.1) in Sudan, 22.8 (18.8, 27.4) in Yemen, and 25 (21.6, 28.4) in Afghanistan in 2019. The highest decline in neonatal mortality between 1990 and 2019 was observed in Saudi Arabia (-85.3%) and the lowest decline was estimated for Yemen (-45.3%) (Figure 3A, Table 1). In 2019, all countries in North Africa and Middle East achieved the SDG target of neonatal mortality less than 12 deaths per 1000 live births except for the three countries of Afghanistan, Yemen, and Sudan.
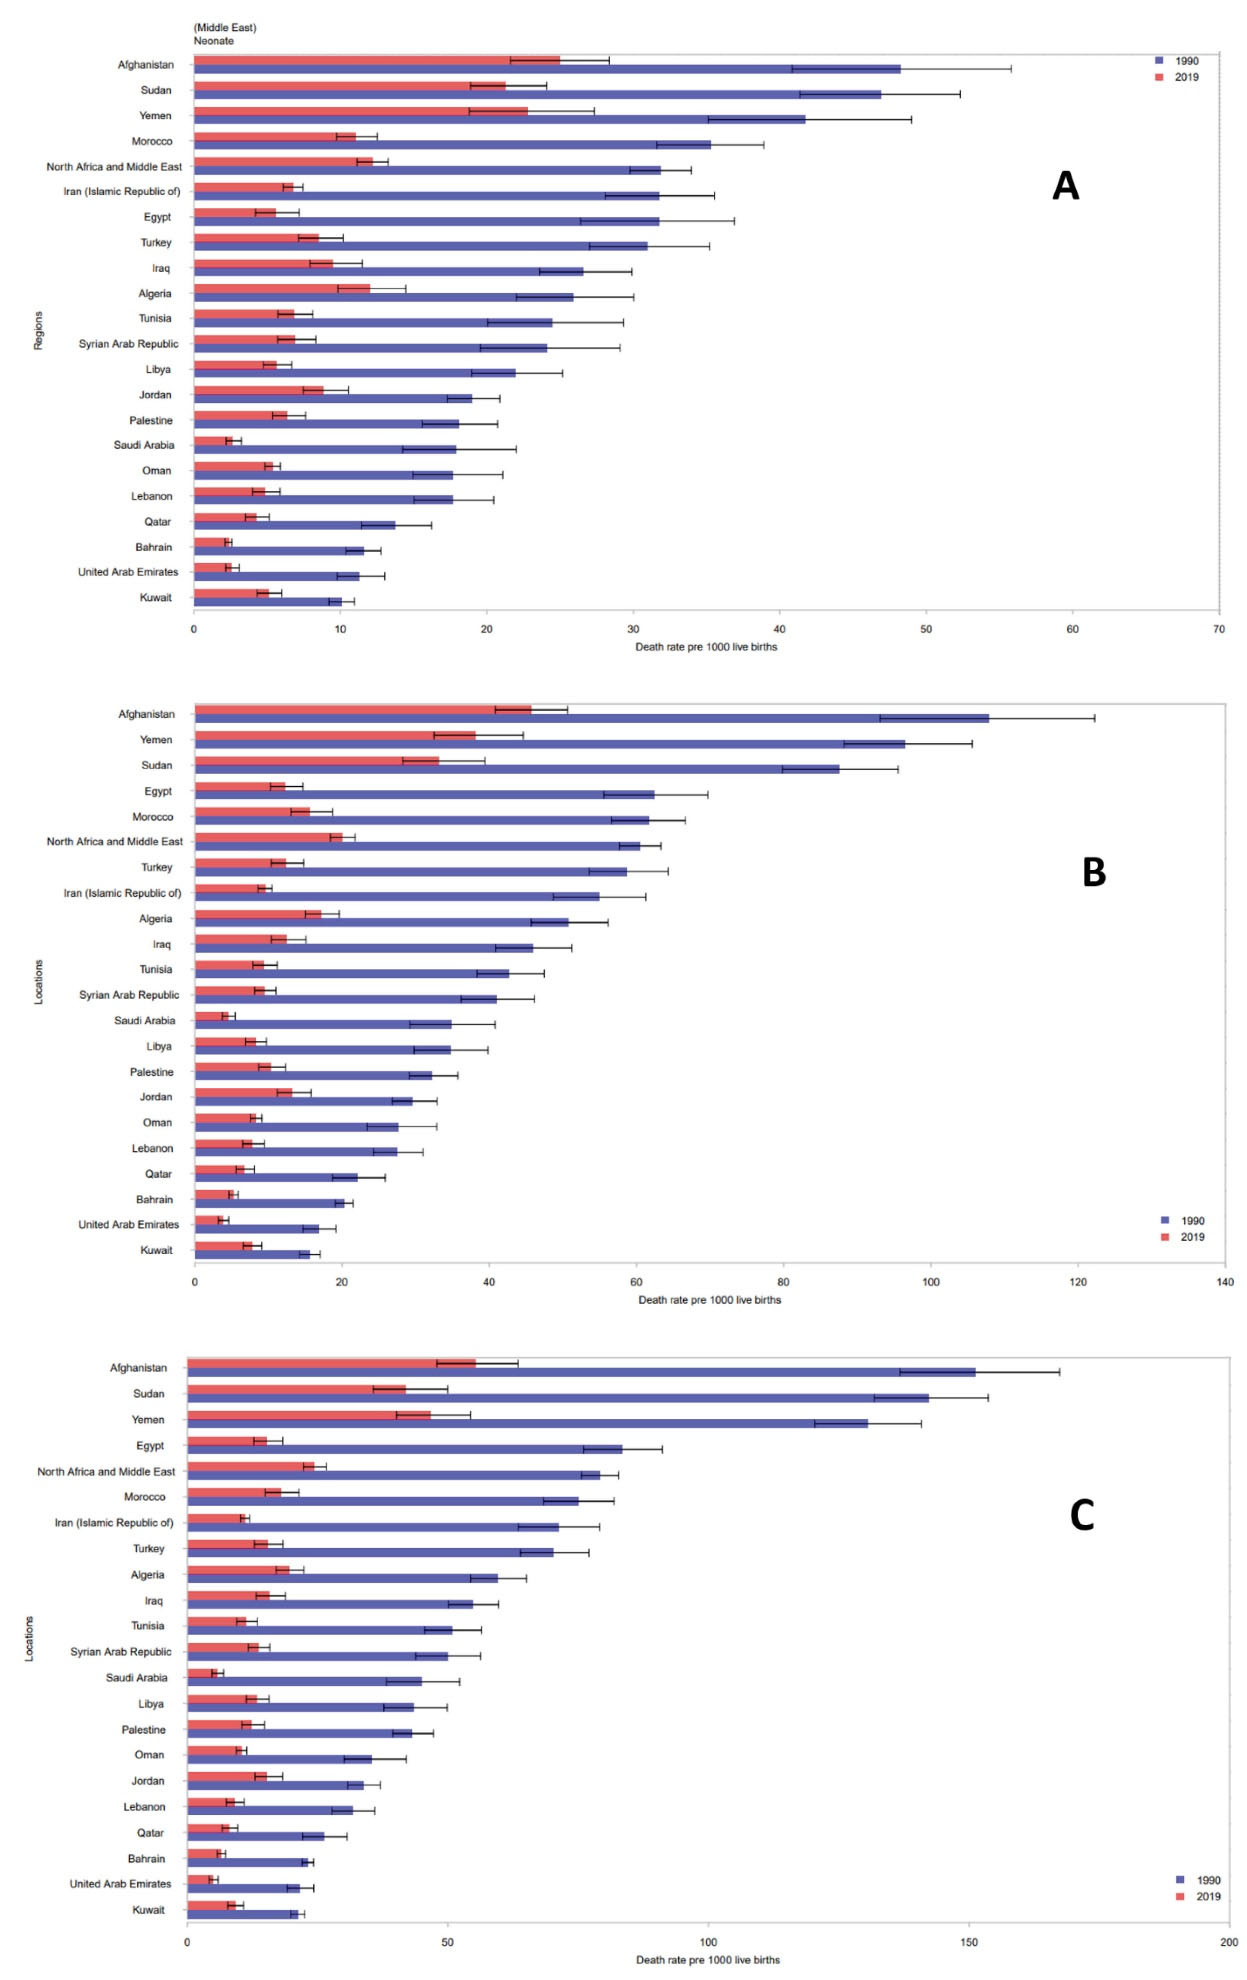
Figure 3.
Neonate, Infant, and Child Mortality Rates Across Countries in the Region in 1990 and 2019. A() Neonate Mortality. (B) Infant mortality. (C) Child mortality.
.
Neonate, Infant, and Child Mortality Rates Across Countries in the Region in 1990 and 2019. A() Neonate Mortality. (B) Infant mortality. (C) Child mortality.
The mortality rate among infants under 1 year ranged from 3.8 (3.2, 4.6) per 1000 live births in the United Arab Emirates to 33.1 (28.2, 39.4) in Sudan, 38.1 (32.5, 44.6) in Yemen, and 45.7 (40.8, 50.6) in Afghanistan in 2019. The highest decline in infant mortality between 1990 and 2019 was observed in Saudi Arabia (-87.2%) and the lowest decline was estimated for Kuwait (-50.5%) (Figure 3B, Table 2).
Similarly, in 2019, the U5MR ranged from 5.0 (4.2–6.0) per 1000 live births in the United Arab Emirates to 41.9 (35.7, 50) in Sudan, 46.7 (40.2, 54.4) in Yemen, and 55.3 (47.9–63.5) in Afghanistan. Actually in 2019, all countries in North Africa and Middle East achieved the SDG target of under 5 mortality less than 25 deaths per 1000 live births except for the three countries of Afghanistan, Yemen, and Sudan. The highest decline in under 5 mortality since 1990 was observed in Saudi Arabia (-87.2%) and the lowest (-54.7%) in Jordan (Figure 3C, Table 3).
Neonatal disorders, congenital birth defects, and lower respiratory infections were the three main causes of neonatal, infant, and child mortality in almost all countries in North Africa and Middle East (Figure 4A to 4C). Egypt was an exception in which, diarrheal diseases ranked first in both infant and child mortality (Figure 4B and 4C). Conflict and terrorism, diarrheal diseases, sexually transmitted infections, and tetanus ranked 4th to 7th among neonates (Figure 4A). Diarrheal diseases, conflict and terrorism, and whooping cough ranked 4th to 6th in both infants and children in most countries (Figure 4B and 4C). In infants, sexually transmitted infections excluding HIV ranked 7th in 2019. In children, however, road injuries ranked 7th.
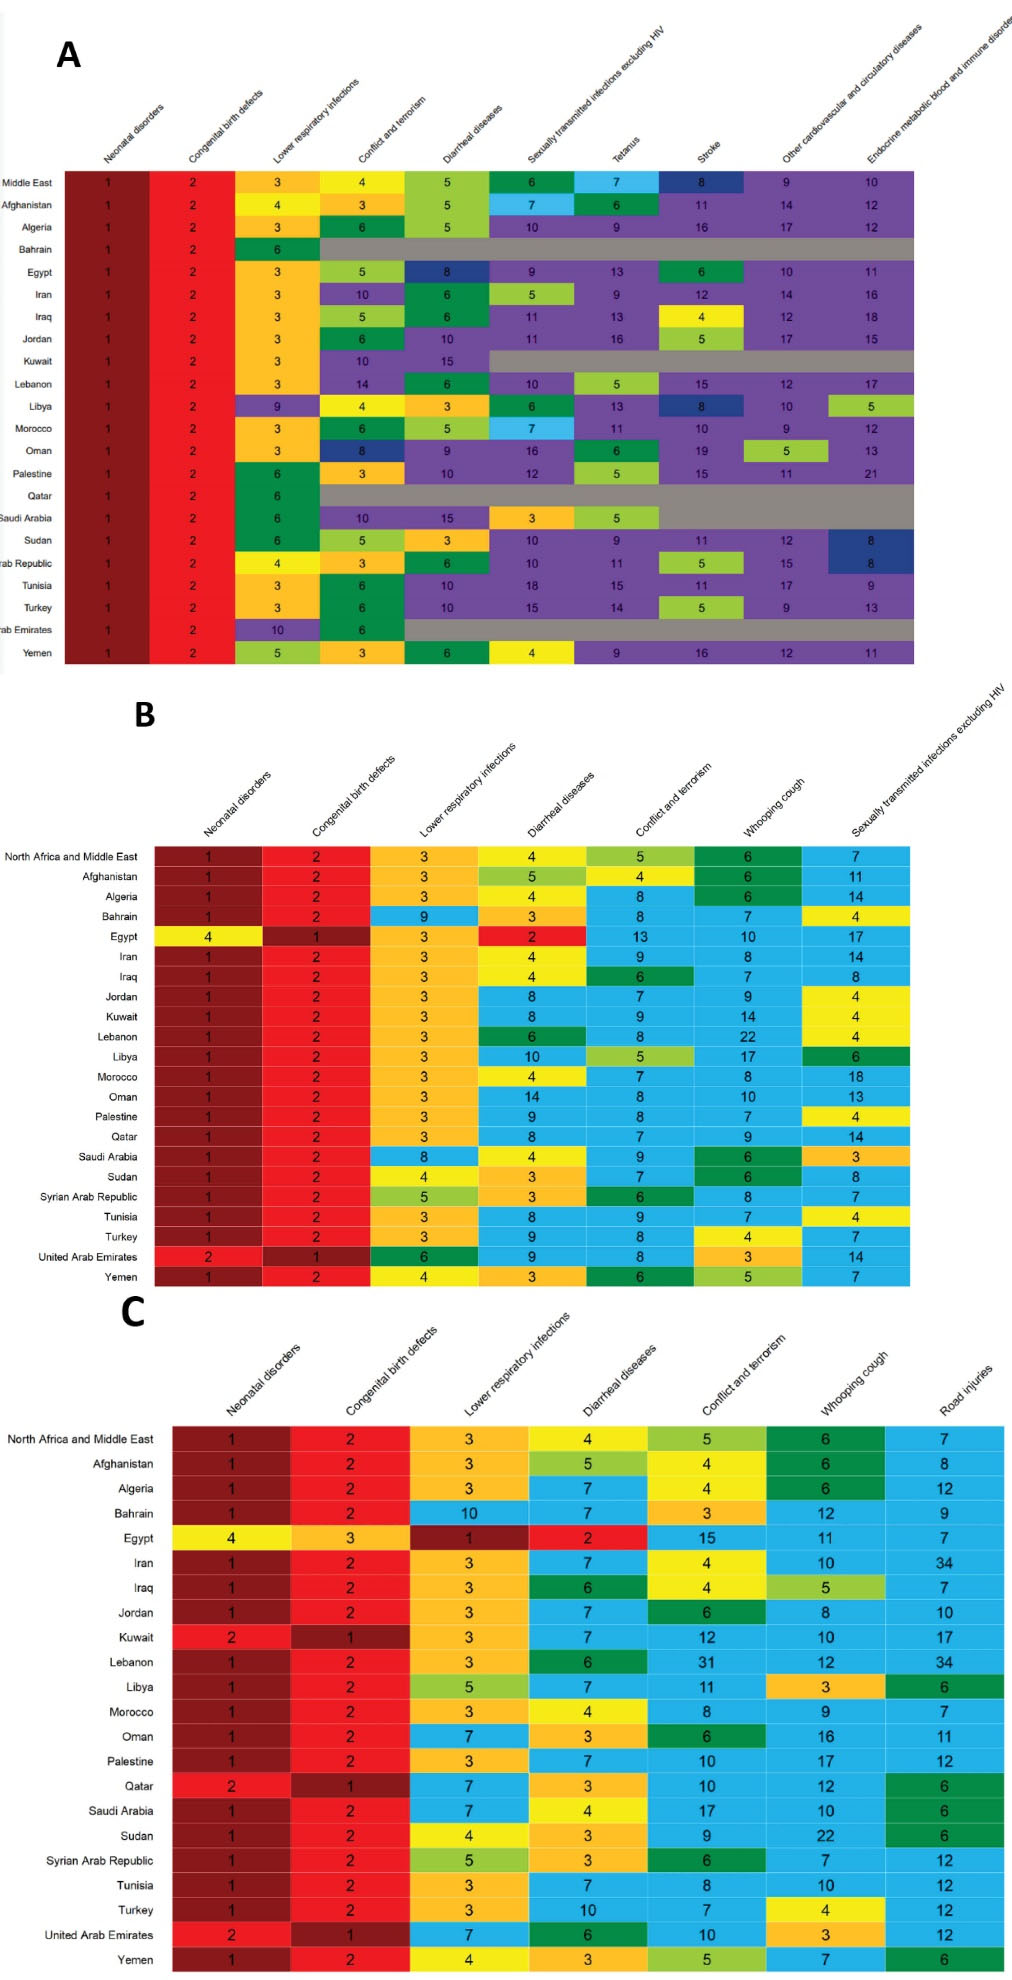
Figure 4.
Infant and Child Deaths by Cause in 2019. (A) Neonate mortality. (B) Infant mortality. (C) Child mortality.
.
Infant and Child Deaths by Cause in 2019. (A) Neonate mortality. (B) Infant mortality. (C) Child mortality.
In North Africa and Middle East, the share of neonatal disorders out of all causes of neonatal mortality was 65.1% in 1990 and 64.7% in 2019. Among all neonatal disorders in 2019, 55.2% were due to neonatal preterm birth, 27.9% were due to other neonatal disorders, 10% were due to neonatal encephalopathy due to birth asphyxia and trauma, 5.5% were due to neonatal sepsis and other neonatal infections, and 1.3% were due to hemolytic disease and other neonatal jaundice. The order and share of each cause out of neonatal diseases were almost the same in 1990.
The share of neonatal disorders out of all causes of infant mortality was 45.0% in 2019. Respective figures for congenital birth defects and lower respiratory infections were 22.6% and 9.9% in 2019 (Figure 4B). In children, however, the share of neonatal disorders out of the total causes of death among children under 5 years was 37.3%. Respective figures for congenital birth defects and lower respiratory infections were 21.0% and 10.2% in 2019.
Figure 5 demonstrates the trends in neonate, infant, and child mortality versus SDI across countries from 1990 to 2019. Trends demonstrate an apparent decrease in mortality in all countries. The ratio of highest to lowest death rates in neonates, however, increased from 4.8 in 1990 to 10.4 in 2019. Respective figures for infant mortality were 6.9 and 12.0 in 1990 and 2019, and for child mortality were 7.1 in 1990 and 11.1 in 2019.
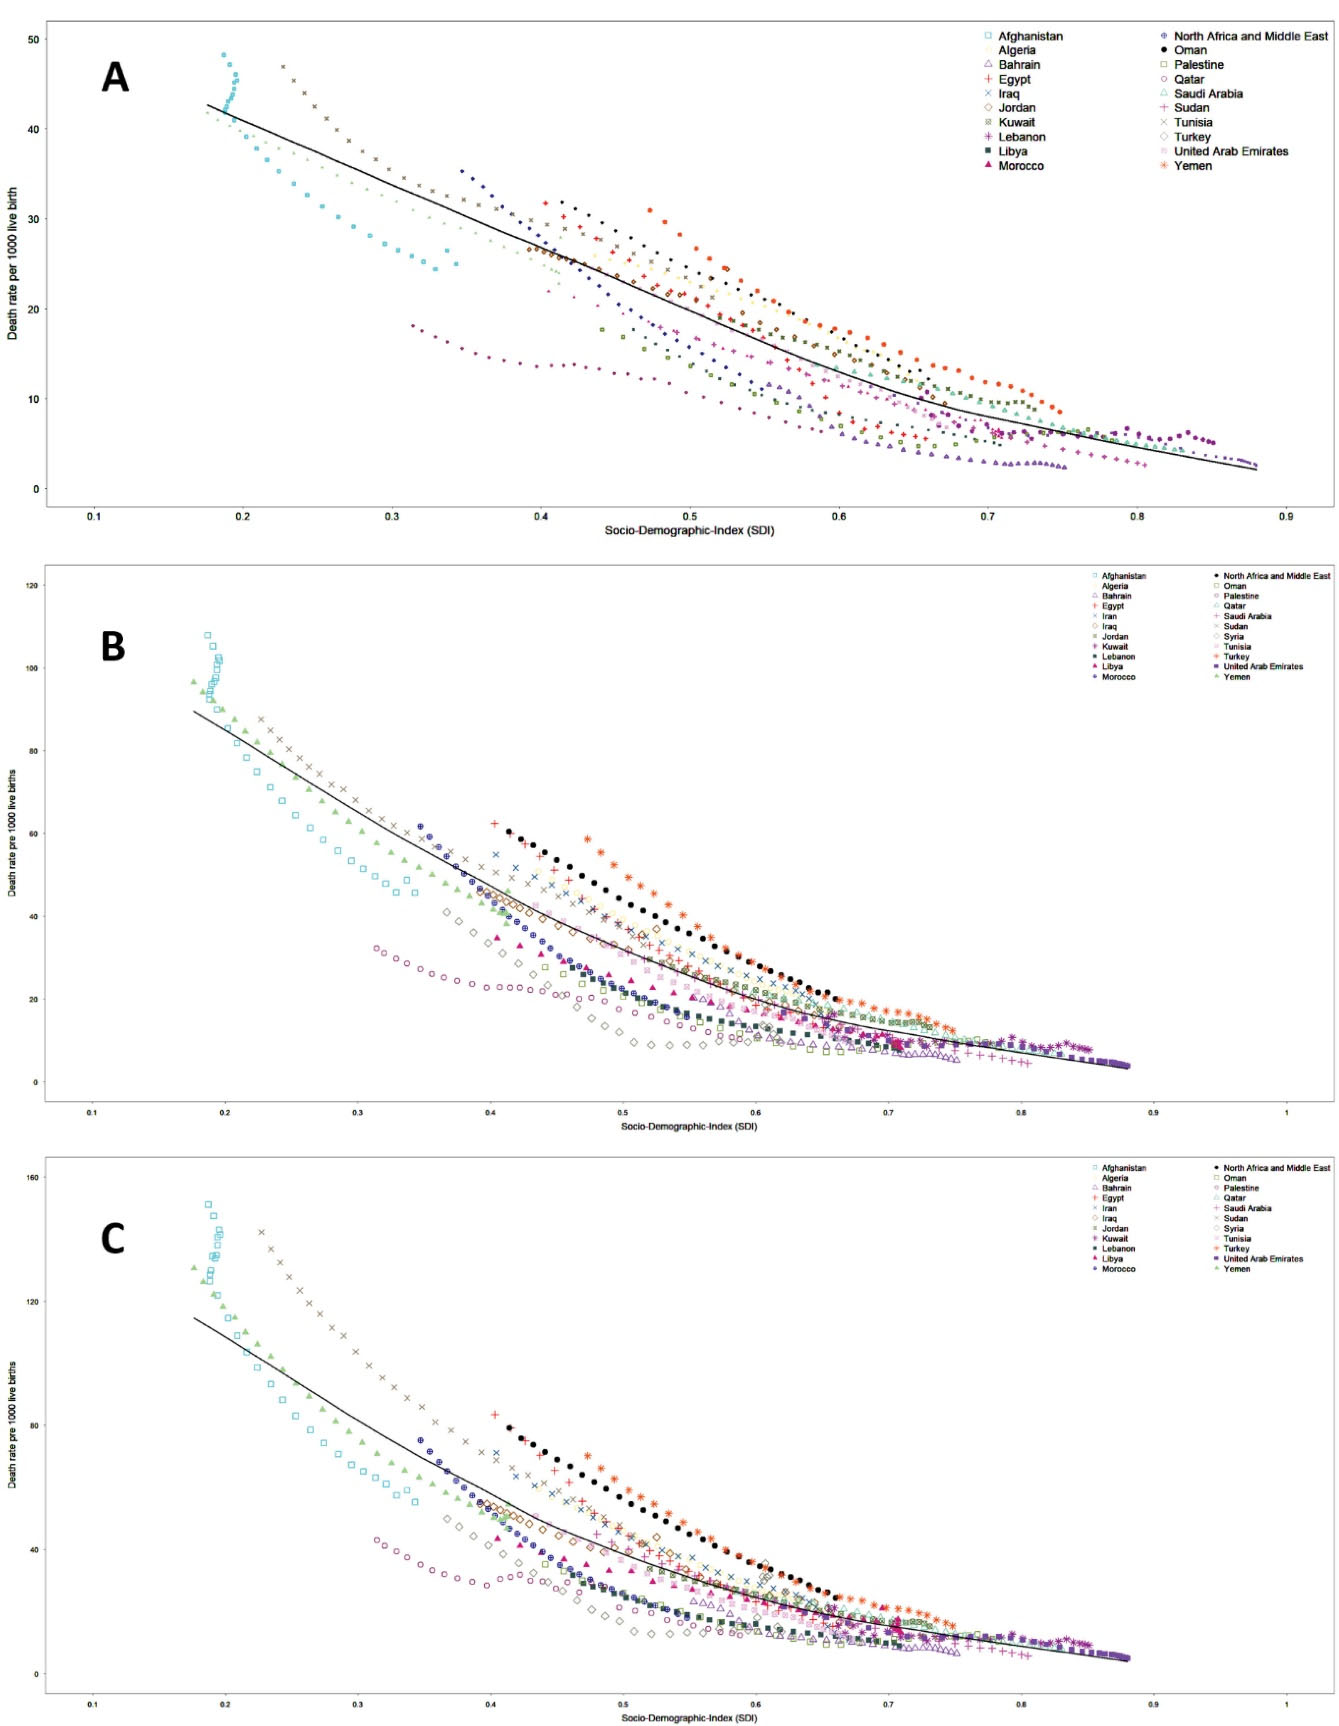
Figure 5.
The Trend in Infant and Child Mortality Along with Increase in Sociodemographic Index Across Countries in North Africa and Middle East from 1990 to 2019. (A) Neonate Mortality. (B) Infant mortality. (C) Child mortality.
.
The Trend in Infant and Child Mortality Along with Increase in Sociodemographic Index Across Countries in North Africa and Middle East from 1990 to 2019. (A) Neonate Mortality. (B) Infant mortality. (C) Child mortality.
Discussion
Our study shows that neonates, infant, and child mortality rates in North Africa and Middle East significantly declined since 1990, by 61.7%, 66.9%, and 69.2% respectively. The number of deaths also shows a significant decrease. Mortality rates for neonates, infants, and children in the region were consistently lower than global estimates during the past three decades. The majority of deaths among children were due to neonate and infant mortality in all years.
Although the decline is observed in all countries of the region, considerable disparity still exists between high-income and low-income countries. In 2019, the ratio of highest to lowest death rates were 10.4, 12.0, and 11.1 for neonate, infant, and child mortality respectively. Overall, in 2019, Afghanistan, Sudan, and Yemen, which had the lowest SDI in the region, together accounted for 56.6%, 58.7% and 58.8% of total deaths among neonates and infants and children respectively at the regional level and are the only countries that haven’t achieved the SDG targets of less than 12 deaths per 1000 live births for neonates and 25 deaths per 1000 live births for children. High-income Arab countries (Bahrain, Kuwait, Oman, Qatar, Saudi Arabia, and United Arab Emirates) contributed to slightly over 1.5% of total deaths among infants and children in the region. Saudi Arabia had relatively higher mortality rates than other high-income Arab countries in the region in 2019, despite the substantial decrease since 1990. Generally, in countries with SDI lower than the median in the region, neonate, infant, and child mortality rates were higher. Exceptions were Jordan and Turkey, which despite their relatively high SDI had high mortality rates. Palestine and Syrian Arab Republic were the opposite and had low mortality rates despite their low SDI.
Our study shows that neonatal disorders are the main causes of death among neonates and infants and children in North Africa and Middle East, followed by congenital birth defects, lower respiratory infections, and diarrheal diseases. The pattern is quite similar between countries in this region and between the region and the globe. The age distribution of mortality among children shows that the risk of mortality is highest during the first 28 days of life, the neonatal period.13 The high share of neonatal disorders out of under 5 deaths highlights the need for urgent actions in order to save newborn lives. Reduction in neonatal mortality requires greater investment in the healthcare infrastructure with the aim of improving coverage, quality, and equity of care in antenatal period.14 It will also require intensive care for mothers and newborns at birth and in the first week of life, which not only prevents neonatal mortality, it will also prevent stillbirths and disability.15,16
Infectious diseases remain the leading causes of infant mortality along with preterm birth and intrapartum-related complications. Moreover, malnutrition in children, particularly in case of severe acute malnutrition, leads to a higher risk of death from these common diseases.17 Access to basic interventions such as antenatal care, childbirth delivery care, postnatal care, vaccination, and early childhood care can substantially prevent neonate, infant, and child mortality.17,18 Reduction in infectious causes of neonate, infant, and child mortality requires improved nutrition, extensive vaccination programs, and improved quality of care.17 As infectious diseases disproportionately affect children in poor settings and remain highly prevalent, integrated and targeted policies are mandatory.19 Addressing diarrheal diseases requires improved sanitation and hygiene, provision of safe drinking water, vaccination, and oral rehydration therapy.20 Preventing neonatal mortality will not be accomplished without skilled personnel attendance at birth and availability of hospital care in case of emergencies.21
The impact of intensive focus and targeted actions of the global community on reductions in child mortality in the past three decades is undeniable. However, progress will not last without the continued, determined, and cooperative action of the global community. Neonate, infant, and child mortality are absolutely preventable.17 Equity in access to appropriate high quality health care is key for preventing infant and child mortality specifically in vulnerable groups.
Our study demonstrates that despite ongoing conflicts, wars, and political and economic turmoil, the sociodemographic index has increased and neonate and infant and child health has improved during the past 30 years in all countries of the region.22 However, the pace of improvement is not homogenous across countries. Conflict and terrorism were main causes of infant and child mortality in Afghanistan, Libya, and Syrian Arab Republic in 2019.
Reliable estimates of neonate, infant, and child mortality at the regional, national, and even subnational levels are essential for evidence-based policymaking to improve children’s survival. In the absence of reliable and continually collected vital registration data, evidence-based estimation of child mortality for monitoring child mortality levels and progress will not be feasible. Nations should be encouraged to improve the quality and completeness of their vital registration systems as the main sources of data for cost-effective policy making at the regional and national levels. Successful experiences can be shared with countries in which sufficient progress in the trend of child mortality has not been achieved.
The current study is the most comprehensive effort so far that addresses neonate and infant and child mortality by cause and by country in North Africa and Middle East during the past three decades. Yet, our study has limitations similar to previous iterations of GBD, which mainly include lack of primary data. The incompleteness and misclassification of the vital registration data in the region is one of the main limitations of this study. Another limitation of this study is the information bias in recorded data. The bias may be due to the fact that mothers may not exactly remember the date of birth and death of their children. The misclassification in vital registration systems may have had impacts on accuracy of cause of death estimations among infants and children.
In conclusion, despite considerable improvement in neonate, infant, and child health in North Africa and Middle East, a number of countries have not achieved the SDG targets yet and if the current trend continues, they may be unable to reach the targets by 2030. More importantly, the disparity between countries in the region is increasing. Although the socioeconomic status is a major determinant of children’s health, there are other drivers such as the integrity, quality, and the accessibility of health care system and on the other hand, the socio-political security that determine children’s health. Countries and the international community should take immediate action to end war and bring peace and stability to the region to ensure the health of children.
Acknowledgements
M Jalili acknowledges support from the Department of Microbiology, School of Medicine, Hamadan University of Medical Sciences, Hamadan, Iran. S Rahmani acknowledges support from their colleagues at the Non-Communicable Disease Research Center (NCDRC), Tehran, Iran.
Competing Interests
All authors declare that they have no conflict of interest.
Ethical Approval
This study is compliant with the Guidelines for Accurate and Transparent Health Estimates Reporting (GATHER). We used secondary data in this study, which does not need ethical statement.
Role of the Funding Source
The funders of this study had no role in study design, data collection, data analysis, data interpretation, or the writing of the report. The corresponding author had full access to the data in the study and final responsibility for the decision to submit for publication.
GBD Child Mortality in Middle East Collaborators
Sadaf G Sepanlou, MD,1,2 Hossein Rezaei Aliabadi, MSc,3,4 Mohsen Abbasi-Kangevari, MD,5 Hassan Abolhassani, PhD,6,7 Ali Ahmadi, PhD,8,9 Sepideh Ahmadi, PhD,10 Hossein Akbarialiabad, MD,11 Shohreh Alian Samakkhah, PhD,12 Vahid Alipour, PhD,13,14 Sohrab Amiri, PhD,15 Fazel Isapanah Amlashi, MD,16 Prof Alireza Ansari-Moghaddam, PhD,17 Davood Anvari, PhD,18,19 Jalal Arabloo, PhD,13 Prof Ali A Asadi-Pooya, MD,20,21 Zatollah Asemi, PhD,22 Seyyed Shamsadin Athari, PhD,23 Samad Azari, PhD,24 Hosein Azizi, PhD,25,26 Sara Bagherieh, BSc,27 Farshad Bahrami Asl, PhD,28,29 Ali Bijani, PhD,30 Maria Cheraghi, PhD,31 Milad Dodangeh, MD,32 Fariba Dorostkar, PhD,33 Leila Doshmangir, PhD,34 Roya Ebrahimi, MSc,35 Prof Fatemeh Eghbalian, MD,36 Ebrahim Eini, DDS,37 Sharareh Eskandarieh, PhD,38 Firooz Esmaeilzadeh, PhD,39 Fatemeh Farahmand, BSc,40 Prof Farshad Farzadfar, DSc,5 Masoud Foroutan, PhD,41,42 Nasrin Galehdar, PhD,43 Kazem Ghaffari, MSc,44 Seyyed-Hadi Ghamari, MD,5,45 Reza Ghanbari, PhD,46 Mohammad Ghasemi Nour, MD,47 Maryam Gholamalizadeh, PhD,48 Salime Goharinezhad, PhD,49 Pouya Goleij, MSc,50 Mostafa Hadei, PhD,51 Nima Hafezi-Nejad, MD,52,53 Shokoufeh Hassani, PhD,54 Soheil Hassanipour, PhD,55,56 Mohammad Heidari, PhD,57 Reza Heidari-Soureshjani, MSc,58 Jalil Jaafari, PhD,59 Farhad Jadidi-Niaragh, PhD,60 Amir Jalali, PhD,61,62 Mahsa Jalili, MSc,63 Elham Jamshidi, PharmD,64,65 Farahnaz Joukar, PhD,55,56 Ali Kabir, MD,66 Laleh R Kalankesh, PhD,67 Rohollah Kalhor, PhD,68,69 Naser Kamyari, PhD,70 Salah Eddin Karimi, PhD,71 Leila Keikavoosi-Arani, PhD,72 Mohammad Khammarnia, PhD,73 Maryam Khayamzadeh, MD,74,75 Hamid Reza Khayat Kashani, MD,76 Ali-Asghar Kolahi, MD,45 Hamid Reza Koohestani, PhD,77 Farzan Madadizadeh, PhD,78 Mokhtar Mahdavi, PhD,77 Prof Soleiman Mahjoub, PhD,79,80 Prof Razzagh Mahmoudi, PhD,81 Prof Elaheh Malakan Rad, MD,82 Prof Afshin Maleki, PhD,51,35 Borhan Mansouri, PhD,62 Mohammad Ali Mansournia, PhD,83 Parham Mardi, MD,84 Abdoljalal Marjani, PhD,85 Seyedeh Zahra Masoumi, PhD,86 Maryam Mirzaei, MSc,87 Abdollah Mohammadian-Hafshejani, PhD,8 Marita Mohammadshahi, PhD,88 Amin Mokari, PhD,89 Ali H Mokdad, PhD,90,91 Delaram Moosavi, MD,32 Maryam Moradi, MD,92 Maliheh Moradzadeh, PhD,93 Negar Morovatdar, MD,94 Simin Mouodi, PhD,30 Seyed Aria Nejadghaderi, MD,95,96 Ali Nikoobar, Dipl,45 Ali Nowroozi, BMedSc,53 Hassan Okati-Aliabad, PhD,73 Prof Keyvan Pakshir, PhD,97 Hamidreza Pazoki Toroudi, PhD,98,99 Naeimeh Pourtaheri, PhD,100 Prof Alireza Rafiei, PhD,101,102 Prof Vafa Rahimi-Movaghar, MD,103 Shayan Rahmani, MD,95,5 Vahid Rahmanian, PhD,104 Ali Rajabpour-Sanati, MD,105 Mohammad-Mahdi Rashidi, MD,5,45 Ramin Ravangard, PhD,106 Prof Nima Rezaei, PhD,6,107 Zahed Rezaei, PhD,108 Prof Mohsen Rezaeian, PhD,109 Seyed Mohammad Riahi, PhD,110 Morteza Rostamian, PhD,111 Siamak Sabour, PhD,9 Prof Ehsan Sadeghi, PhD,112 Saeid Sadeghian, MD,113 Reihaneh Sadeghian, PhD,114 Amirhossein Sahebkar, PhD,115,116 Prof Mohammad Ali Sahraian, MD,38 Morteza Saki, PhD,117 Sarvenaz Salahi, MD,66,118 Prof Payman Salamati, MD,103 Taha Samad-Soltani, PhD,119 Arash Sarveazad, PhD,120 Saeed Shahabi, PhD,121 MohammadBagher Shamsi, PhD,122 Kiomars Sharafi, PhD,112 Rahim Ali Sheikhi, BHlthSci,123 Abbas Sheikhtaheri, PhD,124 Soraya Siabani, PhD,125,126 Shima Tabatabai, PhD,127 Moslem Taheri Soodejani, PhD,128 Amir Taherkhani, PhD,129 Amir Tiyuri, MSc,130,131 Sahel Valadan Tahbaz, PhD,132,133 Rohollah Valizadeh, PhD,134 Taraneh Yousefinezhadi, PhD,135 Hossein Yusefi, MSc,136 Iman Zare, BSc,137 Kourosh Zarea, PhD,138 Vida Zaroushani, PhD,139 Mohammad Zoladl, PhD,140 Prof Reza Malekzadeh, MD,1,2 Prof Mohsen Naghavi, PhD.90,91
1Digestive Diseases Research Institute, Tehran University of Medical Sciences, Tehran, Iran; 2Non-communicable Disease Research Center, Shiraz University of Medical Sciences, Shiraz, Iran; 3Department of Epidemiology and Biostatistics, Bam University of Medical Sciences, Tehran, Iran; 4School of Medicine, Bam University of Medical Sciences, Bam, Iran; 5Non-communicable Diseases Research Center, Tehran University of Medical Sciences, Tehran, Iran; 6Research Center for Immunodeficiencies, Tehran University of Medical Sciences, Tehran, Iran; 7Department of Biosciences and Nutrition, Karolinska University Hospital, Huddinge, Sweden; 8Department of Epidemiology and Biostatistics, Shahrekord University of Medical Sciences, Shahrekord, Iran; 9Department of Epidemiology, Shahid Beheshti University of Medical Sciences, Tehran, Iran; 10School of Advanced Technologies in Medicine, Shahid Beheshti University of Medical Sciences, Tehran, Iran; 11Department of Public Health and Community Medicine, Shiraz University of Medical Sciences, Shiraz, Iran; 12Department of Food Hygiene, Amol University of Special Modern Technologies, Amol, Iran; 13Health Management and Economics Research Center, Iran University of Medical Sciences, Tehran, Iran; 14Department of Health Economics, Iran University of Medical Sciences, Tehran, Iran; 15Quran and Hadith Research Center, Baqiyatallah University of Medical Sciences, Tehran, Iran; 16Neuroscience Research Center, Golestan University of Medical Sciences, Gorgan, Iran; 17Department of Epidemiology and Biostatistics, Zahedan University of Medical Sciences, Zahedan, Iran; 18Department of Parasitology, Mazandaran University of Medical Sciences, Sari, Iran; 19Department of Parasitology, Iranshahr University of Medical Sciences, Iranshahr, Iran; 20Epilepsy Research Center, Shiraz University of Medical Sciences, Shiraz, Iran; 21Neurology Department, Thomas Jefferson University, Philadelphia, PA, USA; 22Research Center for Biochemistry and Nutrition in Metabolic Diseases, Kashan University of Medical Sciences, Kashan, Iran; 23Department of Immunology, Zanjan University of Medical Sciences, Zanjan, Iran; 24Hospital Management Research Center, Iran University of Medical Sciences, Tehran, Iran; 25Research Center of Psychiatry and Behavioral Sciences, Tabriz University of Medical Sciences, Tabriz, Iran; 26Department of Epidemiology and Biostatistics, School of Public Health, Tehran University of Medical Sciences, Tehran, Iran; 27School of Medicine, Isfahan University of Medical Sciences, Isfahan, Iran; 28Environmental Health Engineering, Hamedan University of Medical Sciences, Urmia, Iran; 29Environmental Health Engineering, Tehran University of Medical Sciences, Hamadan, Iran; 30Social Determinants of Health Research Center, Babol University of Medical Sciences, Babol, Iran; 31Social Determinants of Health Research Center, Ahvaz Jundishapur University of Medical Sciences, Ahvaz, Iran; 32School of Medicine, Iran University of Medical Sciences, Tehran, Iran; 33Department of Medical Laboratory Sciences, Iran University of Medical Sciences, Tehran, Iran; 34Department of Health Policy and Management, Tabriz University of Medical Sciences, Tabriz, Iran; 35Environmental Health Research Center, Kurdistan University of Medical Sciences, Sanandaj, Iran; 36Department of Medicine, Hamadan University of Medical Sciences, Hamadan, Iran; 37Department of Orthodontics, Ahvaz Jundishapur University of Medical Sciences, Ahvaz, Iran; 38Multiple Sclerosis Research Center, Tehran University of Medical Sciences, Tehran, Iran; 39Department of Public Health, Maragheh University of Medical Sciences, Maragheh, Iran; 40Department of Literature and Humanities, Islamic Azad University, Kermanshah, Iran; 41Department of Medical Parasitology, Abadan University of Medical Sciences, Abadan, Iran; 42Faculty of Medicine, Abadan University of Medical Sciences, Abadan, Iran; 43Department of Surgical Technology, Lorestan University of Medical Sciences, Khorramabad, Iran; 44Department of Laboratory Sciences, Khomein University of Medical Sciences, Khomein, Iran; 45Social Determinants of Health Research Center, Shahid Beheshti University of Medical Sciences, Tehran, Iran; 46Department of Environmental Health Engineering, Qazvin University of Medical Sciences, Qazvin, Iran; 47E-Learning Center, Mashhad University of Medical Sciences, Mashhad, Iran; 48Cancer Research Center, Shahid Beheshti University of Medical Sciences, Tehran, Iran; 49Preventive Medicine and Public Health Research Center, Iran University of Medical Sciences, Tehran, Iran; 50Department of Genetics, Sana Institute of Higher Education, Sari, Iran; 51Department of Environmental Health Engineering, Tehran University of Medical Sciences, Tehran, Iran; 52Department of Radiology and Radiological Science, Johns Hopkins University, Baltimore, MD, USA; 53School of Medicine, Tehran University of Medical Sciences, Tehran, Iran; 54The Institute of Pharmaceutical Sciences (TIPS) Tehran University of Medical Sciences, Tehran University of Medical Sciences, Tehran, Iran; 55Gastrointestinal and Liver Diseases Research Center, Guilan University of Medical Sciences, Rasht, Iran; 56Caspian Digestive Disease Research Center, Guilan University of Medical Sciences, Rasht, Iran; 57Community-Oriented Nursing Midwifery Research Center, Shahrekord University of Medical Sciences, Shahrekord, Iran; 58Tehran University of Medical Sciences, Tehran, Iran; 59Department of Environmental Health Engineering, Guilan University of Medical Sciences, Rasht, Iran; 60Department of Immunology, Tabriz University of Medical Sciences, Tabriz, Iran; 61Health Institute, Kermanshah University of Medical Sciences, Kermanshah, Iran; 62Substance Abuse Prevention Research Center, Kermanshah University of Medical Sciences, Kermanshah, Iran; 63Department of Microbiology, Hamadan University of Medical Sciences, Hamadan, Iran; 64Functional Neurosurgery Research Center, Shahid Beheshti University of Medical Sciences, Tehran, Iran; 65Division of Pulmonary Medicine, Lausanne University Hospital (CHUV), Lausanne, Switzerland; 66Minimally Invasive Surgery Research Center, Iran University of Medical Sciences, Tehran, Iran; 67Social Determinants of Health Research Center, Gonabad University of Medical Sciences, Gonabad, Iran; 68Institute for Prevention of Non-communicable Diseases, Qazvin University of Medical Sciences, Qazvin, Iran; 69Health Services Management Department, Qazvin University of Medical Sciences, Qazvin, Iran; 70Department of Public Health, Abadan University of Medical Sciences, Abadan, Iran; 71Social Determinants of Health Research Center, Tabriz University of Medical Sciences, Tabriz, Iran; 72Department of Healthcare Services Management, Alborz University of Medical Sciences, Karaj, Iran; 73Health Promotion Research Center, Zahedan University of Medical Sciences, Zahedan, Iran; 74Shahid Beheshti University of Medical Sciences, Tehran, Iran; 75The Iranian Academy of Medical Sciences, Tehran, Iran; 76Department of Neurosurgery, Shahid Beheshti University of Medical Sciences, Tehran, Iran; 77Social Determinants of Health Research Center, Saveh University of Medical Sciences, Saveh, Iran; 78Department of Biostatistics and Epidemiology, Yazd University of Medical Sciences, Yazd, Iran; 79Cellular and Molecular Biology Research Center, Babol University of Medical Sciences, Babol, Iran; 80Department of Clinical Biochemistry, Babol University of Medical Sciences, Babol, Iran; 81Department of Food Hygiene and Safety, Qazvin University of Medical Sciences, Qazvin, Iran; 82Department of Pediatric Cardiology, Tehran University of Medical Sciences, Tehran, Iran; 83Department of Epidemiology and Biostatistics, Tehran University of Medical Sciences, Tehran, Iran; 84Non-communicable Diseases Research Center, Alborz University of Medical Sciences, Karaj, Iran; 85Department of Biochemistry, Golestan University of Medical Sciences, Gorgan, Iran; 86Department of Midwifery, Hamadan University of Medical Sciences, Hamadan, Iran; 87Department of Rehabilitation and Sports Medicine, Kermanshah University of Medical Sciences, Kermanshah, Iran; 88National Institute for Health Research, Tehran University of Medical Sciences, Tehran, Iran; 89Department of Community Nutrition, Shahid Beheshti University of Medical Sciences, Tehran, Iran; 90Institute for Health Metrics and Evaluation, University of Washington, Seattle, WA, USA; 91Department of Health Metrics Sciences, School of Medicine, University of Washington, Seattle, WA, USA; 92Iran University of Medical Sciences, Tehran, Iran; 93Joint, Bone, Connective tissue, Rheumatology Research Center (JBCRC), Golestan University of Medical Sciences, Gorgan, Iran; 94Clinical Research Development Unit, Mashhad University of Medical Sciences, Mashhad, Iran; 95School of Medicine, Shahid Beheshti University of Medical Sciences, Tehran, Iran; 96Department of Epidemiology, Non-Communicable Diseases Research Center (NCDRC), Tehran, Iran; 97Department of Medical Mycology and Parasitology, Shiraz University of Medical Sciences, Shiraz, Iran; 98Department of Physiology, Iran University of Medical Sciences, Tehran, Iran; 99Physiology Research Center, Iran University of Medical Sciences, Tehran, Iran; 100Non-communicable Diseases Research Center, Bam University of Medical Sciences, Bam, Iran; 101Department of Immunology, Mazandaran University of Medical Sciences, Sari, Iran; 102Molecular and Cell Biology Research Center, Mazandaran University of Medical Sciences, Sari, Iran; 103Sina Trauma and Surgery Research Center, Tehran University of Medical Sciences, Tehran, Iran; 104Department of Community Medicine, Jahrom University of Medical Sciences, Jahrom, Iran; 105Faculty of Medicine, Birjand University of Medical Sciences, Birjand, Iran; 106Department of Health Services Management, Shiraz University of Medical Sciences, Shiraz, Iran; 107Network of Immunity in Infection, Malignancy and Autoimmunity (NIIMA), Universal Scientific Education and Research Network (USERN), Tehran, Iran; 108School of Public Health, Kermanshah University of Medical Sciences, Kermanshah, Iran; 109Department of Epidemiology and Biostatistics, Rafsanjan University of Medical Sciences, Rafsanjan, Iran; 110Cardiovascular Diseases Research Center, Birjand University of Medical Sciences, Birjand, Iran; 111School of Medicine, Gonabad University of Medical Sciences, Gonabad, Iran; 112Research Center for Environmental Determinants of Health, Kermanshah University of Medical Sciences, Kermanshah, Iran; 113Department of Pediatric Neurology, Ahvaz Jundishapur University of Medical Sciences, Ahvaz, Iran; 114Medical Plants Research Center, Shahrekord University of Medical Sciences, Shahrekord, Iran; 115Applied Biomedical Research Center, Mashhad University of Medical Sciences, Mashhad, Iran; 116Biotechnology Research Center, Mashhad University of Medical Sciences, Mashhad, Iran; 117Department of Microbiology, Ahvaz Jundishapur University of Medical Sciences, Ahvaz, Iran; 118Advanced Therapy Medicinal Products Department, Royan Institution, Tehran, Iran; 119Health Information Technology (HIT), Tabriz University of Medical Sciences, Tabriz, Iran; 120Colorectal Research Center, Iran University of Medical Sciences, Tehran, Iran; 121Health Policy Research Center, Shiraz University of Medical Sciences, Shiraz, Iran; 122Department of Sports Medicine and Rehabilitation, Kermanshah University of Medical Sciences, Kermanshah, Iran; 123Department of Health in Disasters and Emergencies, Shahrekord University of Medical Sciences, Shahrekord, Iran; 124Department of Health Information Management, Iran University of Medical Sciences, Tehran, Iran; 125Department of Health Education and Health Promotion, Kermanshah University of Medical Sciences, Kermanshah, Iran; 126School of Health, University of Technology Sydney, Sydney, NSW, Australia; 127Department of Medical Education, Shahid Beheshti University of Medical Sciences, Tehran, Iran; 128Department of Biostatistics and Epidemiology, Shahid Sadoughi University of Medical Sciences, Yazd, Iran; 129Research Center for Molecular Medicine, Hamadan University of Medical Sciences, Hamadan, Iran; 130Department of Epidemiology and Biostatistics, Birjand University of Medical Sciences, Birjand, Iran; 131Department of Epidemiology and Biostatistics, Iran University of Medical Sciences, Tehran, Iran; 132Clinical Cancer Research Center, Milad General Hospital, Tehran, Iran; 133Department of Microbiology, Islamic Azad University, Tehran, Iran; 134Urmia University of Medical Science, Urmia, Iran; 135Injury Prevention and Safety Promotion Research Center, Shahid Beheshti University of Medical Sciences, Tehran, Iran; 136Department of Internal Medicine, Qom University of Medical Sciences, Qom, Iran; 137Research and Development Department, Sina Medical Biochemistry Technologies, Shiraz, Iran; 138Nursing Care Research Center in Chronic Diseases, Ahvaz Jundishapur University of Medical Sciences, Ahvaz, Iran; 139Department of Occupational Health, Qazvin University of Medical Sciences, Qazvin, Iran; 140Department of Nursing, Yasuj University of Medical Sciences, Yasuj, Iran.
References
- GBD 2019 Diseases and Injuries Collaborators. Global burden of 369 diseases and injuries in 204 countries and territories, 1990-2019: a systematic analysis for the Global Burden of Disease Study 2019. Lancet 2020; 396(10258):1204-22. doi: 10.1016/s0140-6736(20)30925-9 [Crossref] [ Google Scholar]
- GBD 2019 Demographics Collaborators. Global age-sex-specific fertility, mortality, healthy life expectancy (HALE), and population estimates in 204 countries and territories, 1950-2019: a comprehensive demographic analysis for the Global Burden of Disease Study 2019. Lancet 2020; 396(10258):1160-203. doi: 10.1016/s0140-6736(20)30977-6 [Crossref] [ Google Scholar]
- You D, Hug L, Ejdemyr S, Idele P, Hogan D, Mathers C. Global, regional, and national levels and trends in under-5 mortality between 1990 and 2015, with scenario-based projections to 2030: a systematic analysis by the UN Inter-agency Group for Child Mortality Estimation. Lancet 2015; 386(10010):2275-86. doi: 10.1016/s0140-6736(15)00120-8 [Crossref] [ Google Scholar]
- GBD 2015 Child Mortality Collaborators. Global, regional, national, and selected subnational levels of stillbirths, neonatal, infant, and under-5 mortality, 1980-2015: a systematic analysis for the Global Burden of Disease Study 2015. Lancet 2016; 388(10053):1725-74. doi: 10.1016/s0140-6736(16)31575-6 [Crossref] [ Google Scholar]
- GBD 2019 Viewpoint Collaborators. Five insights from the Global Burden of Disease Study 2019. Lancet 2020; 396(10258):1135-59. doi: 10.1016/s0140-6736(20)31404-5 [Crossref] [ Google Scholar]
- Burstein R, Henry NJ, Collison ML, Marczak LB, Sligar A, Watson S. Mapping 123 million neonatal, infant and child deaths between 2000 and 2017. Nature 2019; 574(7778):353-8. doi: 10.1038/s41586-019-1545-0 [Crossref] [ Google Scholar]
- United Nations International Children’s Emergency Fund. Under-Five Mortality. UNICEF Data. September, 2019. Available from: https://data.unicef.org/topic/child-survival/under-five-mortality. Accessed November 28, 2021.
- UN Department of Economic and Social Affairs. Sustainable Development Goals. 2015. New York, NY: United Nations; 2019. Available from: https://sdgs.un.org/goals. Accessed February 3, 2021.
- Liu L, Oza S, Hogan D, Chu Y, Perin J, Zhu J. Global, regional, and national causes of under-5 mortality in 2000-15: an updated systematic analysis with implications for the Sustainable Development Goals. Lancet 2016; 388(10063):3027-35. doi: 10.1016/s0140-6736(16)31593-8 [Crossref] [ Google Scholar]
- Mokdad AH, Forouzanfar MH, Daoud F, El Bcheraoui C, Moradi-Lakeh M, Khalil I. Health in times of uncertainty in the eastern Mediterranean region, 1990-2013: a systematic analysis for the Global Burden of Disease Study 2013. Lancet Glob Health 2016; 4(10):e704-13. doi: 10.1016/s2214-109x(16)30168-1 [Crossref] [ Google Scholar]
- GBD 2019 Under-5 Mortality Collaborators. Global, regional, and national progress towards Sustainable Development Goal 3.2 for neonatal and child health: all-cause and cause-specific mortality findings from the Global Burden of Disease Study 2019. Lancet 2021;398(10303):870-905. 10.1016/s0140-6736(21)01207-1.
- Foreman KJ, Lozano R, Lopez AD, Murray CJ. Modeling causes of death: an integrated approach using CODEm. Popul Health Metr 2012; 10:1. doi: 10.1186/1478-7954-10-1 [Crossref] [ Google Scholar]
- UNICEF Data: Monitoring the Situation of Children and Women. Neonatal Mortality. 2020. Available from: https://data.unicef.org/topic/child-survival/neonatal-mortality/. Accessed August 11, 2021.
- UNICEF, WHO, World Bank Group, United Nations. Levels & Trends in Child Mortality. Report 2020. Estimates Developed by the UN Inter-Agency Group for Child Mortality Estimation. 2020. Available from: https://www.unicef.org/reports/levels-and-trends-child-mortality-report-2020. Accessed August 11, 2021.
- World Health Organization, United Nations Children’s Fund. Every Newborn: An Action Plan to End Preventable Deaths. June 30, 2014. Available from: www.healthynewbornnetwork.org/resource/every-newborn-actionplan. Accessed September 1, 2020.
- Bhutta ZA, Das JK, Bahl R, Lawn JE, Salam RA, Paul VK. Can available interventions end preventable deaths in mothers, newborn babies, and stillbirths, and at what cost?. Lancet 2014; 384(9940):347-70. doi: 10.1016/s0140-6736(14)60792-3 [Crossref] [ Google Scholar]
- World Health Organization (WHO). Children: Improving Survival and Well-Being. 2020. Available from: https://www.who.int/news-room/fact-sheets/detail/children-reducing-mortality. Accessed August 11, 2021.
- World Health Organization (WHO), Maternal and Child Epidemiology Estimation Group (MCEE). Child Causes of Death, 2000-2017. Geneva. 2018. Available from: https://www.who.int/healthinfo/global_burdendisease/estimates/en/index2.html. Accessed August 26, 2020.
- UNICEF. Childhood Diseases. 2020. Available from: https://www.unicef.org/health/childhood-diseases. Accessed August 11, 2021.
- Bhutta ZA, Das JK, Walker N, Rizvi A, Campbell H, Rudan I. Interventions to address deaths from childhood pneumonia and diarrhoea equitably: what works and at what cost?. Lancet 2013; 381(9875):1417-29. doi: 10.1016/s0140-6736(13)60648-0 [Crossref] [ Google Scholar]
- UNICEF Data: Monitoring the Situation of Children and Women. Delivery Care. 2021. Available from: https://data.unicef.org/topic/maternal-health/delivery-care/. Accessed August 11, 2021.
- Akseer N, Kamali M, Husain S, Mirza M, Bakhache N, Bhutta ZA. Strategies to avert preventable mortality among mothers and children in the Eastern Mediterranean region: new initiatives, new hope. East Mediterr Health J 2015; 21(5):361-73. doi: 10.26719/2015.21.5.361 [Crossref] [ Google Scholar]