Arch Iran Med. 26(9):510-528.
doi: 10.34172/aim.2023.77
Original Article
Dysregulated Forkhead Box (FOX) Genes Association with Survival Prognosis, Anti-tumor Immunity, and Key Targeting Drugs in Colon Adenocarcinoma
Qian Xie Conceptualization, Data curation, Formal analysis, Investigation, Methodology, Software, Visualization, Writing – original draft, 1
Jie Wang Conceptualization, Data curation, Formal analysis, Investigation, Methodology, Software, Visualization, Writing – original draft, 2
Xingchen Peng Conceptualization, Funding acquisition, Project administration, Resources, Supervision, Validation, Writing – review & editing, 3, * 
Author information:
1International Medical Center/Ward of General Practice, West China Hospital, Sichuan University, Chengdu, 610000, China
2Department of Pharmacy, First Affiliated Hospital of Xinjiang Medical University, Urumqi, 830011, China
3Department of Biotherapy, Cancer Center, West China Hospital, Sichuan University, Chengdu, 610000, China
Abstract
Background:
Several studies have revealed that the aberrant expressions of forkhead box (FOX) genes are associated with carcinogenesis. However, the crucial biological functions of the FOX gene in colon adenocarcinoma (COAD) remain unknown.
Methods:
The TCGA-COAD dataset (n=328) was utilized for determining the deregulated FOX genes and their association with functional enrichment, protein-protein interaction (PPI), survival prognosis, anti-tumor immunity, cancer-associated pathways, and biological processes in COAD. In addition, we used GSE166427 (GPL13667) as a validation cohort (n=196). Molecular docking studies were applied to perform the drug interactions.
Results:
The FOX genes are deregulated in the COAD (Log2 FC>0.50, P<0.05), and the PPI network of FOX members is substantially related to the enrichment of cancerous signaling, immune responses, and cellular development (FDR<0.05). A worse prognosis for overall survival in COAD individuals is connected with the subgroup of FOX transcripts (P≤0.05). FOXD4, FOXH1, and FOXS1 were identified as predictive variables in the univariate and multivariate Cox regression models (P≤0.05). FOXH1 and FOXS1 are substantially linked to the deregulated immunity in COAD (R>0.20, P<0.01). Furthermore, FOXS1 expression regulates cancer-associated pathways and biological processes (P<0.05). Moreover, FOXD4, FOXH1, and FOXS1 are genetically altered and showed diagnostic efficacy in COAD. We revealed that FOXD4, FOXH1, and FOXS1 are consistently deregulated in GSE166427 (P<0.05). Finally, molecular docking revealed that FOXH1 interacted with various drugs, including belinostat, entinostat, and panobinostat.
Conclusion:
The FOX genes have a strong correlation with the poor prognosis for survival, tumor immunity, cancer-associated pathways, and biochemical processes that cause the pathogenesis of COAD.
Keywords: Colon adenocarcinoma, Cancer-associated pathways, FOX genes, Immune responses, Molecular docking
Copyright and License Information
© 2023 The Author(s).
This is an open-access article distributed under the terms of the Creative Commons Attribution License (
https://creativecommons.org/licenses/by/4.0), which permits unrestricted use, distribution, and reproduction in any medium, provided the original work is properly cited.
Cite this article as: Xie Q, Wang J, Peng X. Dysregulated forkhead box (FOX) genes association with survival prognosis, anti-tumor immunity, and key targeting drugs in colon adenocarcinoma. Arch Iran Med. 2023;26(9):510-528. doi: 10.34172/aim.2023.77
Introduction
In the human genome, there are more than 50 forkhead box (FOX) genes or proteins, divided into 19 subclasses (FOXA to FOXS) based upon sequence homology inside and outside the forkhead domain.1,2 Various FOX genes regulate crucial physiological processes, including embryogenesis, cellular homeostasis, and the immune system.3,4 The functioning of the lung, kidney, immune function, and nerves is also regulated by the FOX genes.3,4 The FOX genes promote and collaborate with certain other active gene transcription and epigenetic controllers, acting as transcriptional activators, transcriptional repressors, and pioneer factors.2 It has been reported that the FOX genes and their translated protein are involved in the development, metabolism, cancer, and aging.2,4 Cancer genesis, growth, maintenance, advancement, and medication resistance are all closely correlated with dysfunctional FOX genes.2 Also, FOX genes are associated with substantial cancerous biological processes, including senescence, apoptosis, DNA damage repair, and survival of cancer patients.2,5 Various FOX genes are related to tumor-promoting inflammation, immune destruction, genome instability and mutation, angiogenesis, proliferative signaling, tumor invasion, metastasis, and resisting cell death.3
Malignancies in several tissues, such as the lung, breast, and thyroid, have been linked to the amplification of FOX genes.6 FOX genes act downstream of several oncogenic signaling pathways, including PI3K–AKT, ERK, Wnt, β-catenin, EGFR, and NF-κB-IKKβ, associated with CRC cancerogenesis.7 The clinical results of cancer patients are strongly correlated with deregulated FOX genes. For example, Shan et al discovered that nasopharyngeal cancer patients have a poor prognosis when their FOXJ2 (OMIM number: 619162) activity is increased.8 According to Song et al, the crucial predictive factor for overall survival (OS) in those with various malignancies is FOXM1 (OMIM number: 602341).9 The FOXD1 (OMIM number: 601091) protein was significantly elevated in the primary HNSCC cohort. Significant associations existed between its abundance, cervical node metastases, and poor overall and disease-free survival (DFS).10 In colorectal cancer, the expression of FOXM1 correlates with poor prognosis.11 In addition to the clinical outcomes, FOX genes are critically associated with immunoregulatory functions. The FOX genes are associated with immunoregulation, including regulating CD4 + T cell tolerance, thymic development, macrophage differentiation, natural killer cell effector function, and T cell activation.4 The FOXOs regulate the immune system by modulating tumor and stromal cells.12 Martin et al showed that the FOXP3 (OMIM number: 300292) is an immunosuppressive marker in human malignancies.13 These studies provided crucial information about the oncogenic roles of FOX genes associated with cancer onset, development, metastasis, tumor immunity, and signaling pathways in human malignancies.
Globally, colon cancer is the second most common cause of mortality (9.4%), and the third most commonly diagnosed disease (10.0%).14 Here, we present a comprehensive bioinformatics study to evaluate the changes in FOX gene expression levels. Also, we identified the functional enrichment of deregulated FOX genes in colon adenocarcinoma (COAD). Additionally, we investigated the involvement of FOX genes in protein-protein interactions (PPIs) and their association with the enrichment of pathways. We further examined the connection between altered FOX genes and the survival rates of COAD individuals. Univariate, multivariable, and nomogram analysis revealed COAD’s independent prognostic FOX genes. Then, we identified that the prognostic FOX genes were related to the immune content, stromal content, purity of tumor, immune signatures, immune ratio, cancer-associated signaling pathways, and cancer hallmark biological processes. Finally, we observed that the prognostic FOX genes were genetically altered and effective in diagnosing COAD individuals.
Materials and Methods
Datasets
We transformed the data into a log2-base conversion after downloading the TCGA COAD dataset from https://portal.gdc.cancer.gov. We utilized relevant information from the TCGA COAD cohort to compare the survivorship of two patient groups in the database (https://portal.gdc.cancer.gov) (n = 328, 287 tumor samples, and 41 normal samples). In addition, we investigated the transcript levels of FOX genes in multiple types of cancer using the Oncomine repository (https://www.oncomine.org/resource/login.html). To determine the genetic changes in three prognostic FOX genes, we utilized COAD (TCGA, Firehose Legacy) individuals with mutation and CNA information (n = 220) in cBioPortal (http://www.cbioportal.org/). Finally, we used GSE166427 (GPL13667, 98 tumor samples, and 98 normal samples) as a validation cohort (n = 196).15
Investigations of FOX Gene Variations in COAD Compared to the Control
The Limma linear model, which has a range of test conditions and predictors, is specifically made for assessing complicated studies. When comparing COAD samples (n = 287) to control samples (n = 41), we used the R package “limma” to find the relevant DEGs.16 Utilizing the TCGA COAD cohort, we identified the significant FOX genes in the COAD individuals relative to the control sample.
Gene-Set Enrichment Analysis
A computational technique called gene-set enrichment analysis (GSEA) is capable of helping assess if a predefined gene collection exhibits statistically meaningful, concordant changes between two biological contexts. Using the GSEA tool, we investigated the GSEA of the candidate genes.17 We entered the gene set into the GSEA tool to find the significant GO and pathways. The Reactome pathways18 significantly associated with the FOX genes were identified.
Protein-Protein Interaction Network Construction
Using the NetworkAnalyst application, we developed a PPI network of the DEGs.19 In the NetworkAnalyst software, we used the STRING tool20 by selecting interactome with a medium interactome score (400) and confidence score cutoff of 900, and required experimental evidence was also determined. The node explorer module of NetworkAnalyst was used to find the ranking genes (those with a high degree of connectivity to specific other nodes) in the PPI network.19 To find KEGG pathways connected to generated PPI, we used the function explorer module of the NetworkAnalyst tool. Using the software Cytoscape 3.8.2, we illustrated the PPI networks.21
Survival Analysis of FOX Genes in COAD
In the two groups of individuals with colon cancer, we evaluated the OS and the DFS. According to our assessment of the clinical information from the TCGA COAD cohort, the follow-up period was 147.9 months. The survival disparities between the high-expression group (HEG) and low-expression group (LEG) of FOX genes in COAD individuals were identified using the Kaplan-Meier method (HEG > median > LEG). Utilizing the R package “survival”, the survival implications of significant FOX genes in the TCGA COAD database were investigated.22 We used the “coxph” function in the R package “survival” for the univariate and multivariable Cox regression assessments of variables. The nomogram was generated using the R package “rms”.22
ESTIMATE Algorithm for Quantifying Immune Score, Stromal Score, and Tumor Purity
The R-based ESTIMATE program predicts the tumor purity, immune score, and stromal score. This technique utilizes the gene expression patterns of 141 stromal genes and 141 immune genes.23 Applying relevant gene expression matrix information, the quantity of stromal cells and immune cells infiltrating into malignant cells was determined.23 Next, we contrasted the immune, stromal, and tumor purity values between the HEG and LEG of crucial FOX genes (Wilcoxon sum rank test, P < 0.05).
Single Sample Gene Set Enrichment Analysis
Instead of using a sample population, the single sample gene set enrichment analysis (ssGSEA) approach operates on a single-sample basis. For every pairing of samples and genes set in the cancer tissues, we used the extended modules of GSEA and ssGSEA to determine the enrichment levels of immune cells, cancer-associated pathways, and hallmark biological processes.24 To calculate the ssGSEA scores of particular immune signatures, pathways, and biological processes, we assembled the marker gene sets.25-28 We identified the ssGSEA score of various immune signatures (such as CAFs, HLA genes, immune cell infiltrate genes, immune checkpoint genes, pDCs, etc), cancerous KEGG pathways (such as cell cycle, JAK-STAT, MAPK, mTOR, WNT, etc),29 and three key hallmark biological processes (epithelial-mesenchymal transition [EMT], angiogenesis, and hypoxia). The relationships between the enrichment levels (ssGSEA scores) of immunological signatures, pathway activity, and biological processes and the levels of FOX gene expression were investigated using Spearman’s correlation test. The marker gene sets with immunological signatures, pathway activity, and biological processes are listed in Table S1 (see Supplementary file 1).
Analysis of Genetic Changes in Prognostic FOX Genes
Utilizing cBioPortal, an open-access platform for assessing genetic modifications in multimodal cancer studies, we were able to determine the genetic changes in independent prognostic FOX genes. In our work, we identified the genetic of prognostic FOX genes using the COAD (TCGA, Firehose Legacy) individuals with mutation and CNA data (n = 220) in cBioPortal (http://www.cbioportal.org/).
Diagnostic Effectiveness of Prognostic FOX Genes in COAD
To properly evaluate ROC curves and partial areas under the curve, the “pROC” R package provides an assortment of statistical models. The area under the ROC curve (AUC) was determined using the “pROC” R package to assess the capacity to discriminate between COAD and healthy samples. The graph was shown to determine the diagnostic values of prognostic FOX genes.30 The AUC values represented the diagnostic value and differences between tumor and healthy samples for each gene, and the AUC > 0.5 for a single gene was defined as the diagnostic efficacy.31
Validation of Key Gene Expression in an Independent Dataset
As a validation cohort, we used GSE166427 (GPL13667) to confirm the expression levels of critical genes (n = 196, 98 tumor samples, and 98 normal samples).15 This database aimed to evaluate the expression profiling of COAD and normal adjacent colon cells. The platform GPL13667 is based on Affymetrix Human Genome U219 Array. We downloaded the series matrix data and utilized the t-test to identify the DEGs between colon tumors and adjacent normal colon cells. We selected the genes with the highest value of fold change for multiple probes of a single gene.
Exploration of the Drug Compound’s Interaction with Key Genes and their Molecular Docking
We employed the NetworkAnalyst19 software for extracting the chemical-protein interaction. We inputted the gene symbol of key genes into the NetworkAnalyst19 software and identified the networks or sub-networks between the genes and chemical compounds. We utilized the Cytoscape tool to show the retrieved drug-gene interaction. Then, we used these interacting compounds for molecular docking analysis. We downloaded the protein product of FOXH1 (OMIM number: 603621) (protein database ID: 5XOC) and all other chemical compounds interacting with this gene. We prepared the protein using Discovery studio (https://3ds.com/products-services/biovia/products). First, we eliminated ligands and water molecules from the receptor proteins. Next, we prepared the ligand using PyRx (https://pyrx.sourceforge.io/). Finally, using PyRx, we conducted a molecular docking investigation (https://pyrx.sourceforge.io/).
Statistical Analysis
Log2FC > 0.50 (absolute value) and P < 0.05 were the cutoffs we used to identify the DEGs. For choosing the significantly enriched GOs and pathways, the FDR < 0.05 was considered. When comparing the two patient groups’ survival rates using Cox regression, a P ≤ 0.05 was considered significant. The Wilcoxon sum rank test was performed to contrast the two patient groups (P < 0.05). To determine the significance levels between the two factors, we used either Pearson’s or Spearman’s correlation test. The levels of FOX genes and the ssGSEA scores of immunological signatures, pathways, and biological processes were analyzed using Spearman’s correlation test because the data were not normally distributed (P < 0.05). We used Pearson’s correlation test to examine the relationships between the expression levels of FOX genes and the expression levels of other immune-marker genes and FOX genes since the data were normally distributed (P < 0.05). During the validation of key genes in the GSE166427, the P < 0.05 cutoff was established as the significant value.We used the R package “ggplot2” to present the information from our investigation.
Results
Identifying the Differentially Expressed FOX Genes in the COAD
We analyzed the COAD’s significantly differentially expressed FOX genes relative to the normal samples (Log2FC > 0.50, Adjusted P< 0.0001). We found that 17 FOX genes have increased expression levels in COAD (Table 1). In contrast, 15 FOX genes exhibited a downregulation trend in the COAD (Table 1). Figure 1 shows the heatmap of the genes’ transcriptional value with differential expression. After passing the threshold, the expression of additional FOX genes did not change in the TCGA COAD samples.
Table 1.
Differential Expression of FOX Genes in TCGA COAD
|
Entrez ID
|
Log2 FC
|
Regulatory Status
|
Mean Expression level
|
P
Value
|
Adjusted
P
Value
|
Symbols of genes
|
Name of Genes (OMIM#)
|
| 94234 |
5.86 |
Up
regulated |
8.8838 |
1.62E-76 |
6.95E-75 |
FOXQ1
|
forkhead box Q1 (612788) |
| 2297 |
1.91 |
3.9676 |
5.79E-06 |
9.96E-06 |
FOXD1
|
forkhead box D1 (601091) |
| 3170 |
1.56 |
9.3515 |
5.76E-18 |
2.75E-17 |
FOXA2
|
forkhead box A2 (600288) |
| 2307 |
1.51 |
5.0226 |
2.09E-16 |
6.92E-16 |
FOXS1
|
forkhead box S1 (602939) |
| 2305 |
1.39 |
10.434 |
4.36E-27 |
4.24E-26 |
FOXM1
|
forkhead box M1 (602341) |
| 50943 |
1.22 |
5.1661 |
3.03E-07 |
5.70E-07 |
FOXP3
|
forkhead box P3 (300292) |
| 2309 |
1.14 |
10.417 |
2.57E-24 |
1.58E-23 |
FOXO3
|
forkhead box O3 (602681) |
| 2298 |
1.11 |
2.9289 |
3.02E-08 |
6.18E-08 |
FOXD4
|
forkhead box D4 (601092) |
| 116113 |
0.90 |
11.378 |
5.18E-20 |
2.78E-19 |
FOXP4
|
forkhead box P4 (608924) |
| 80020 |
0.90 |
8.7531 |
1.83E-12 |
4.14E-12 |
FOXRED2
|
FAD-dependent oxidoreductase domain containing 2 (613777) |
| 200350 |
0.84 |
2.1282 |
4.59E-07 |
8.23E-07 |
FOXD4L1
|
forkhead box D4 like 1 (611084) |
| 100036519 |
0.69 |
2.2128 |
4.44E-06 |
4.94E-06 |
FOXD4L2
|
forkhead box D4 like2 (611086) |
| 2296 |
0.66 |
6.1097 |
0.006004 |
0.008328 |
FOXC1
|
forkhead box C1 (601090) |
| 2290 |
0.61 |
0.87147 |
0.03668 |
0.045064 |
FOXG1
|
forkhead box G1 (164874) |
| 221937 |
0.58 |
10.438 |
6.08E-09 |
1.31E-08 |
FOXK1
|
forkhead box K1 (616302) |
| 401089 |
0.56 |
0.62423 |
0.002925 |
0.004192 |
FOXL2NB
|
FOXL2 neighbor* |
| 3344 |
0.52 |
9.0173 |
1.18E-14 |
3.62E-14 |
FOXN2
|
forkhead box N2 (143089) |
| 2301 |
-0.76 |
Down
regulated |
1.8929 |
0.000202 |
0.000299 |
FOXE3
|
forkhead box E3 (601094) |
| 4303 |
-0.85 |
9.1094 |
1.99E-14 |
5.34E-14 |
FOXO4
|
forkhead box O4 (300033) |
| 8456 |
-0.95 |
1.6649 |
1.16E-05 |
1.85E-05 |
FOXN1
|
forkhead box N1 (600838) |
| 2308 |
-0.99 |
9.0698 |
2.18E-13 |
5.51E-13 |
FOXO1
|
forkhead box O1 (136533) |
| 2302 |
-1.07 |
4.7494 |
0.027403 |
0.035952 |
FOXJ1
|
forkhead box J1 (602291) |
| 8928 |
-1.15 |
3.8509 |
3.05E-07 |
5.70E-07 |
FOXH1
|
forkhead box H1 (603621) |
| 399823 |
-1.17 |
0.8496 |
5.08E-17 |
1.99E-16 |
FOXI2
|
forkhead box I2 (617202) |
| 1112 |
-1.20 |
10.146 |
2.03E-24 |
1.45E-23 |
FOXN3
|
forkhead box N3 (602628) |
| 2310 |
-1.31 |
9.4959 |
2.04E-32 |
2.93E-31 |
FOXO3B
|
forkhead box O3B* |
| 3169 |
-1.31 |
8.6048 |
7.02E-06 |
1.16E-05 |
FOXA1
|
forkhead box A1(602294) |
| 2294 |
-1.49 |
8.0854 |
2.53E-13 |
6.05E-13 |
FOXF1
|
forkhead box F1 (614975) |
| 2306 |
-1.58 |
7.6406 |
7.41E-17 |
2.65E-16 |
FOXD2
|
forkhead box D2 (602211) |
| 2295 |
-2.48 |
6.5547 |
4.92E-27 |
4.24E-26 |
FOXF2
|
forkhead box F2 (603250) |
| 27022 |
-2.99 |
1.2901 |
1.79E-45 |
3.86E-44 |
FOXD3
|
forkhead box D3 (611539) |
| 93986 |
-3.11 |
4.3298 |
9.00E-18 |
3.87E-17 |
FOXP2
|
forkhead box P2 (605317) |
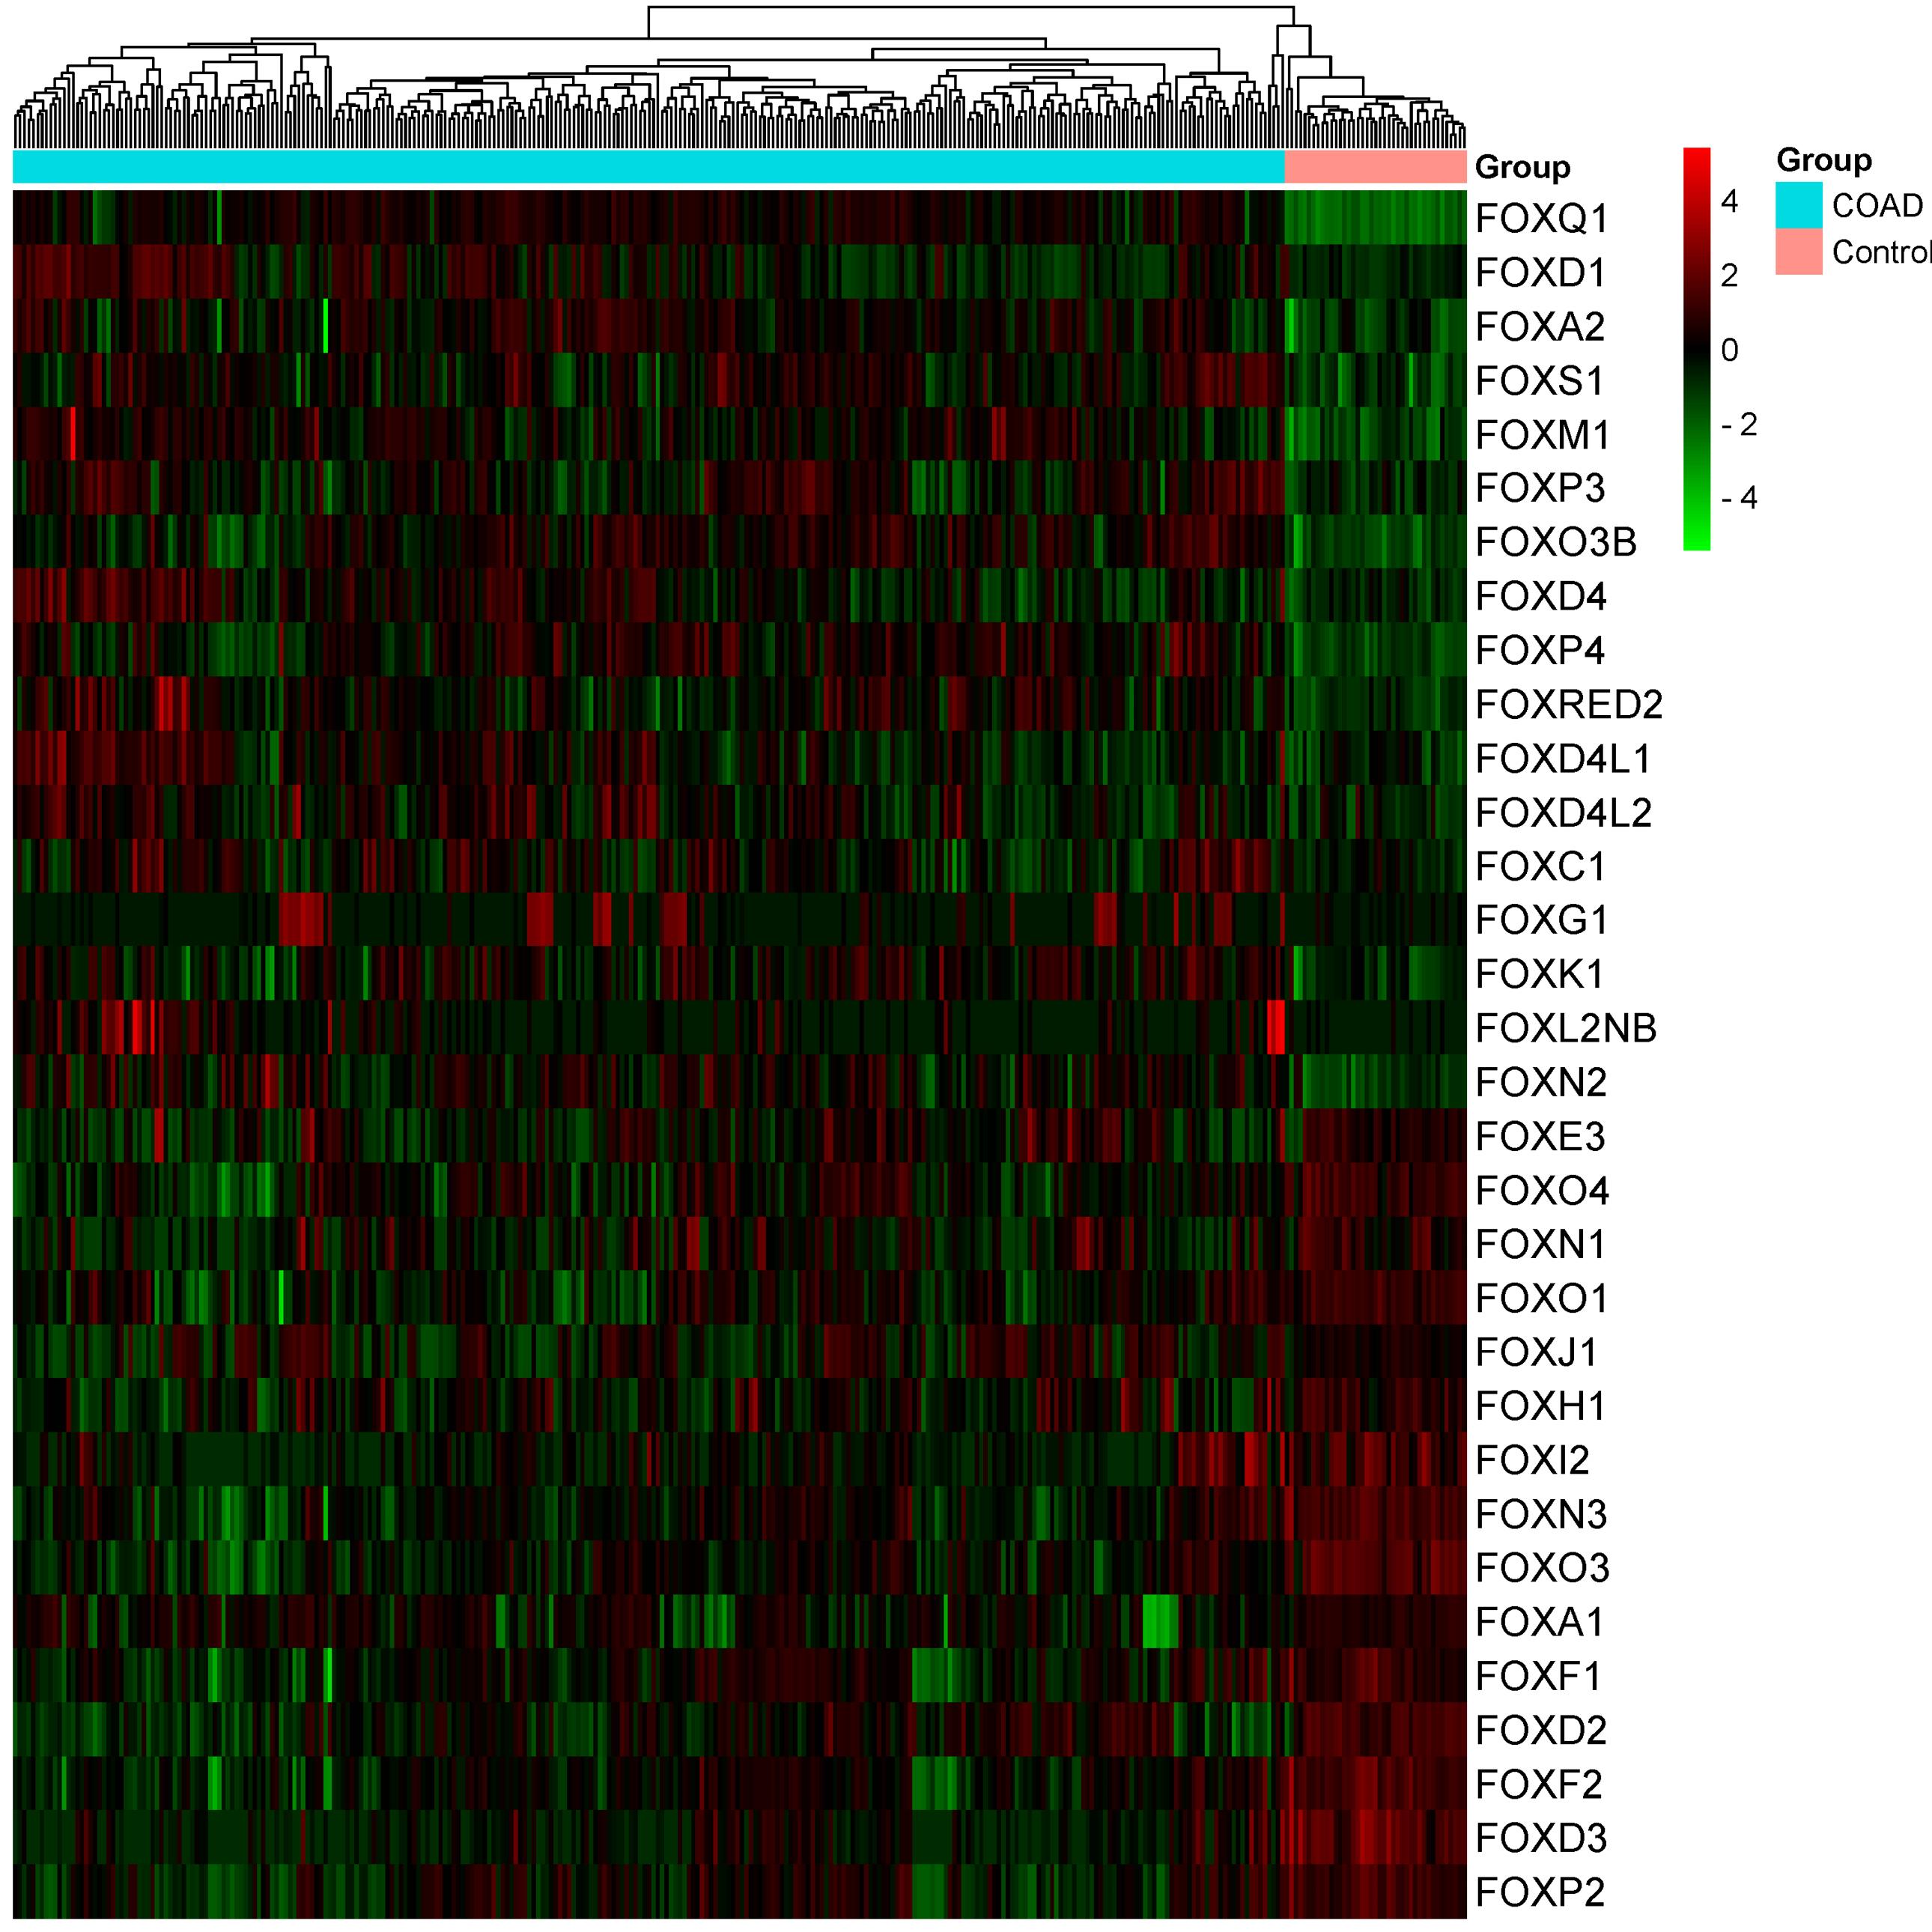
Figure 1.
Heatmap of the 32 Differentially Expressed FOX Genes, Including 17 Upregulated and 15 Downregulated in COAD Individuals
.
Heatmap of the 32 Differentially Expressed FOX Genes, Including 17 Upregulated and 15 Downregulated in COAD Individuals
Association of FOX Genes with Pathway Deregulation and Functional Enrichment
We utilized the GSEA tool to identify the enriched gene ontology (GO) and deregulated pathways significantly linked to the dysfunctional FOX genes (Figure 2). We identified biological processes (such as regionalization, negative regulation of DNA binding transcription factor activity, and positive regulation of developmental process) that strongly correlate to increased FOX genes (Figure 2A). The cellular components, including chromatin and chromosome, are enriched considerably with upregulated FOX genes (Figure 2A). Moreover, we found the six molecular functions (such as DNA binding bending, DNA binding transcription repressor activity, and transcription regulator activity) that strongly correlate to increased FOX genes (Figure 2A). In addition, the downregulated FOX genes enrich GO terms and signaling pathways. We identified 63 biological processes (such as positive regulation of the biosynthetic process, animal organ morphogenesis, and tube development) that are significantly associated with downregulated FOX genes (Figure 2B and Table S2). The chromatin, chromosome, and transcription regulator complex are significantly enriched cellular components related to the decreased FOX genes (Figure 2B). Moreover, we found seven enriched considerably molecular functions related to the decreased FOX genes (Figure 2B).
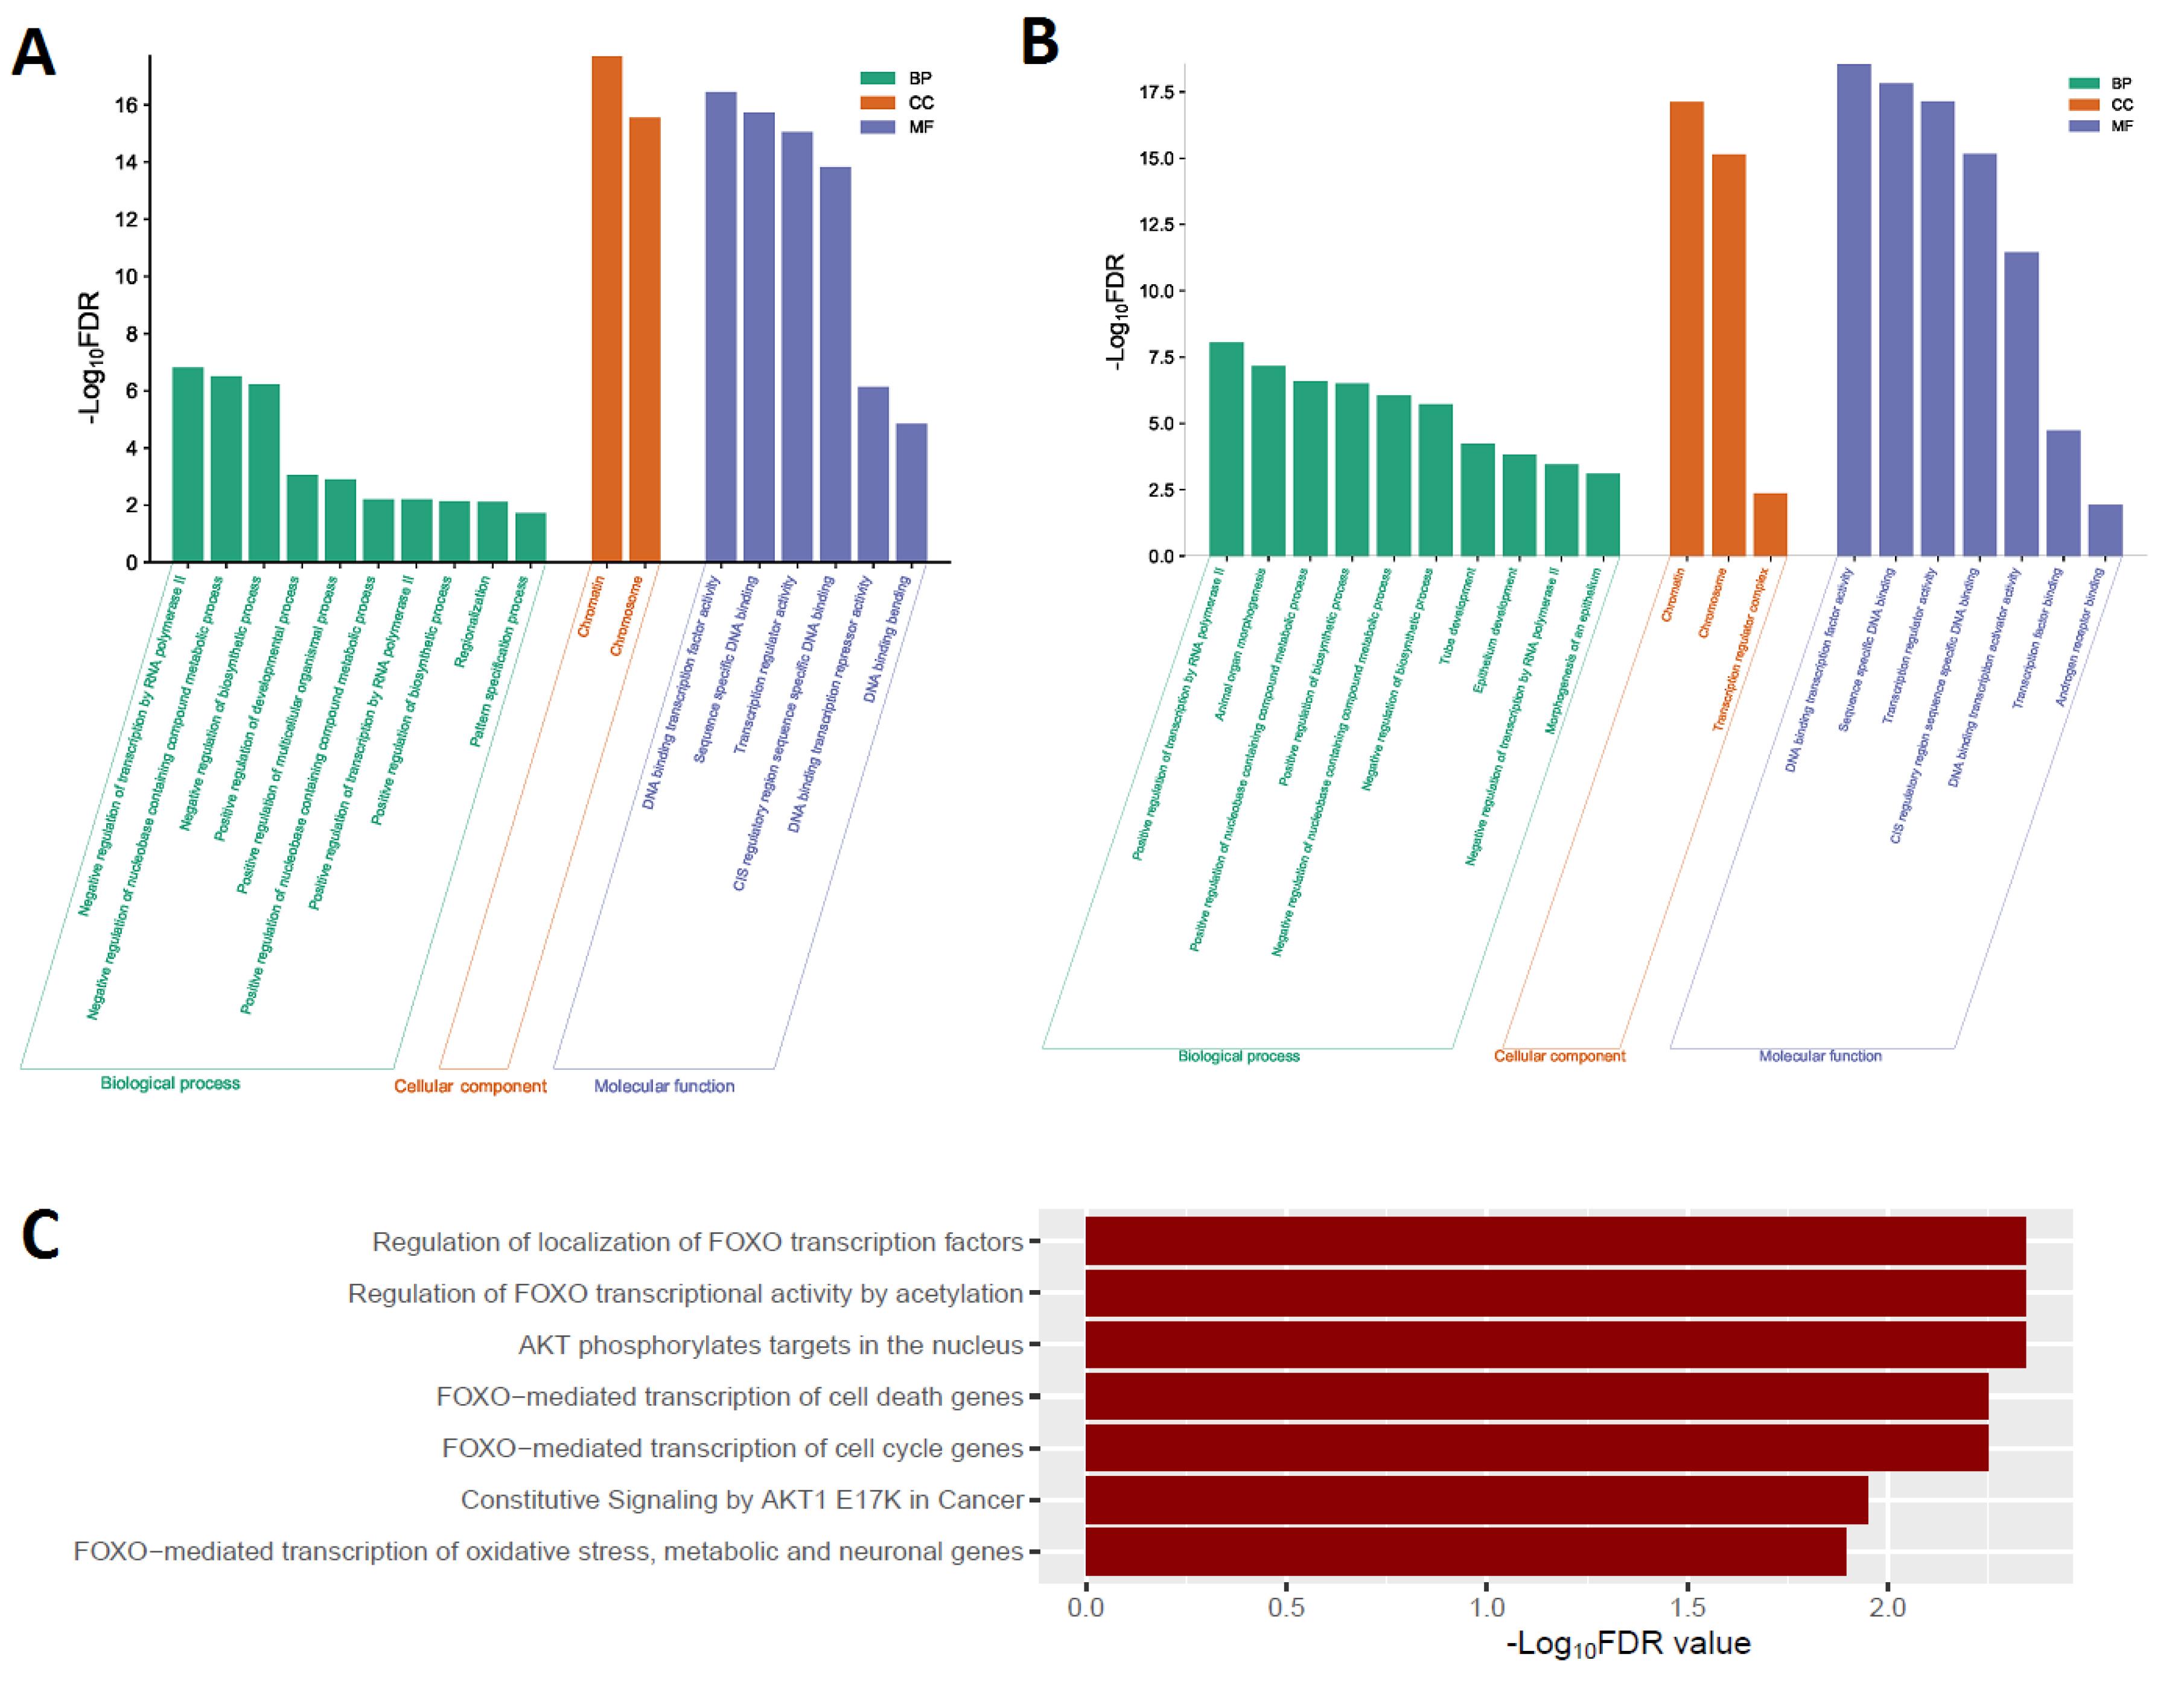
Figure 2.
Significantly Enriched GO and Reactome Pathways Associated with FOX Genes. A. The enriched GOs are associated with upregulated FOX genes in COAD. B. The enriched GOs are associated with downregulated FOX genes in COAD. C. Downregulated FOX genes in COAD regulate the significantly enriched Reactome pathways
.
Significantly Enriched GO and Reactome Pathways Associated with FOX Genes. A. The enriched GOs are associated with upregulated FOX genes in COAD. B. The enriched GOs are associated with downregulated FOX genes in COAD. C. Downregulated FOX genes in COAD regulate the significantly enriched Reactome pathways
Furthermore, we revealed the deregulated Reactome pathways associated with differentially expressed FOX genes. We found that the Reactome FOXO mediated transcription of cell cycle genes pathway is significantly enriched with upregulated FOX genes. In addition, we found seven pathways (such as AKT phosphorylates targets in the nucleus, regulation of FOXO transcriptional activity by acetylation, and regulation of localization of FOXO transcription factors) that are significantly associated with downregulated FOX genes in COAD (Figure 2C). It suggests that COAD transcriptional activity and other carcinogenic signaling mechanisms are correlated to uncontrolled FOX genes.
FOX Genes Associated with PPI Network and Correlated with Each Other
We inputted deregulated FOX genes (Table 1) into the NetworkAnalyst software to construct the PPI network. In the NetworkAnalyst software, we used the STRING tool20 with a medium interactome score (400), and confidence score cutoff of 900, and the required experimental evidence was also selected. In the PPI, we found that the FOX genes are associated with five sub-networks. In sub-network 1, the eight FOX genes, including FOXO1, FOXO3, FOXO4, FOXM1, FOXP3, FOXG1, FOXA1, and FOXH1 are involved in the PPI network (Figure 3A). All nodes in sub-network 1 are listed in Table S3. Interestingly, the function module of the NetworkAnalyst software identifies that sub-network 1 is substantially related to the enriched 95 KEGG pathways (Table S4). The top 30 pathways are illustrated in Figure 3B. These significant (FDR < 0.05) pathways mainly involved with cancer (such as pathways in cancer, endometrial cancer, colorectal cancer, small cell lung cancer, and central carbon metabolism in cancer), immunity (such as Th17 cell differentiation, B cell receptor signaling pathway, and T cell receptor signaling pathway), and cellular signaling and development (such as TGF-beta signaling pathway, cell cycle, and cellular senescence). It suggests that sub-network 1 is related to the regulation of tumor immunity and tumor biology in COAD. In sub-network 2, the FOXD3 interacts with four genes (Figure 3C). In other sub-networks, FOXJ1, FOXF2, and FOXK1 are involved with the PPI network (Figure 3D-F). After determining the PPI of the FOX genes, we hypothesized that the FOX genes are interconnected (Pearson’s correlation test, P > 0.05). Interestingly, we found that some FOX genes correlate with each other (Figure 3G). For example, there is a substantial positive correlation between FOXP3 and FOXF1, FOXF2, FOXD3, FOXN3, FOXP2, FOXI2, FOXS1, FOXC1, and FOXO1 levels (Figure 3G). Similarly, the expression level of FOXS1 has a significant positive correlation with the expression of FOXO1, FOXI2, FOXO4, FOXP3, FOXF1, FOXF2, and FOXD3 (Figure 3G). In contrast, FOXD2 negatively correlates with the expression level of FOXC1, FOXO1, FOXD1, FOXD4, and FOXD4L1 (Figure 3G). It indicates that the FOX genes may be regulating the expression of each other and contribute to the carcinogenesis of COAD.
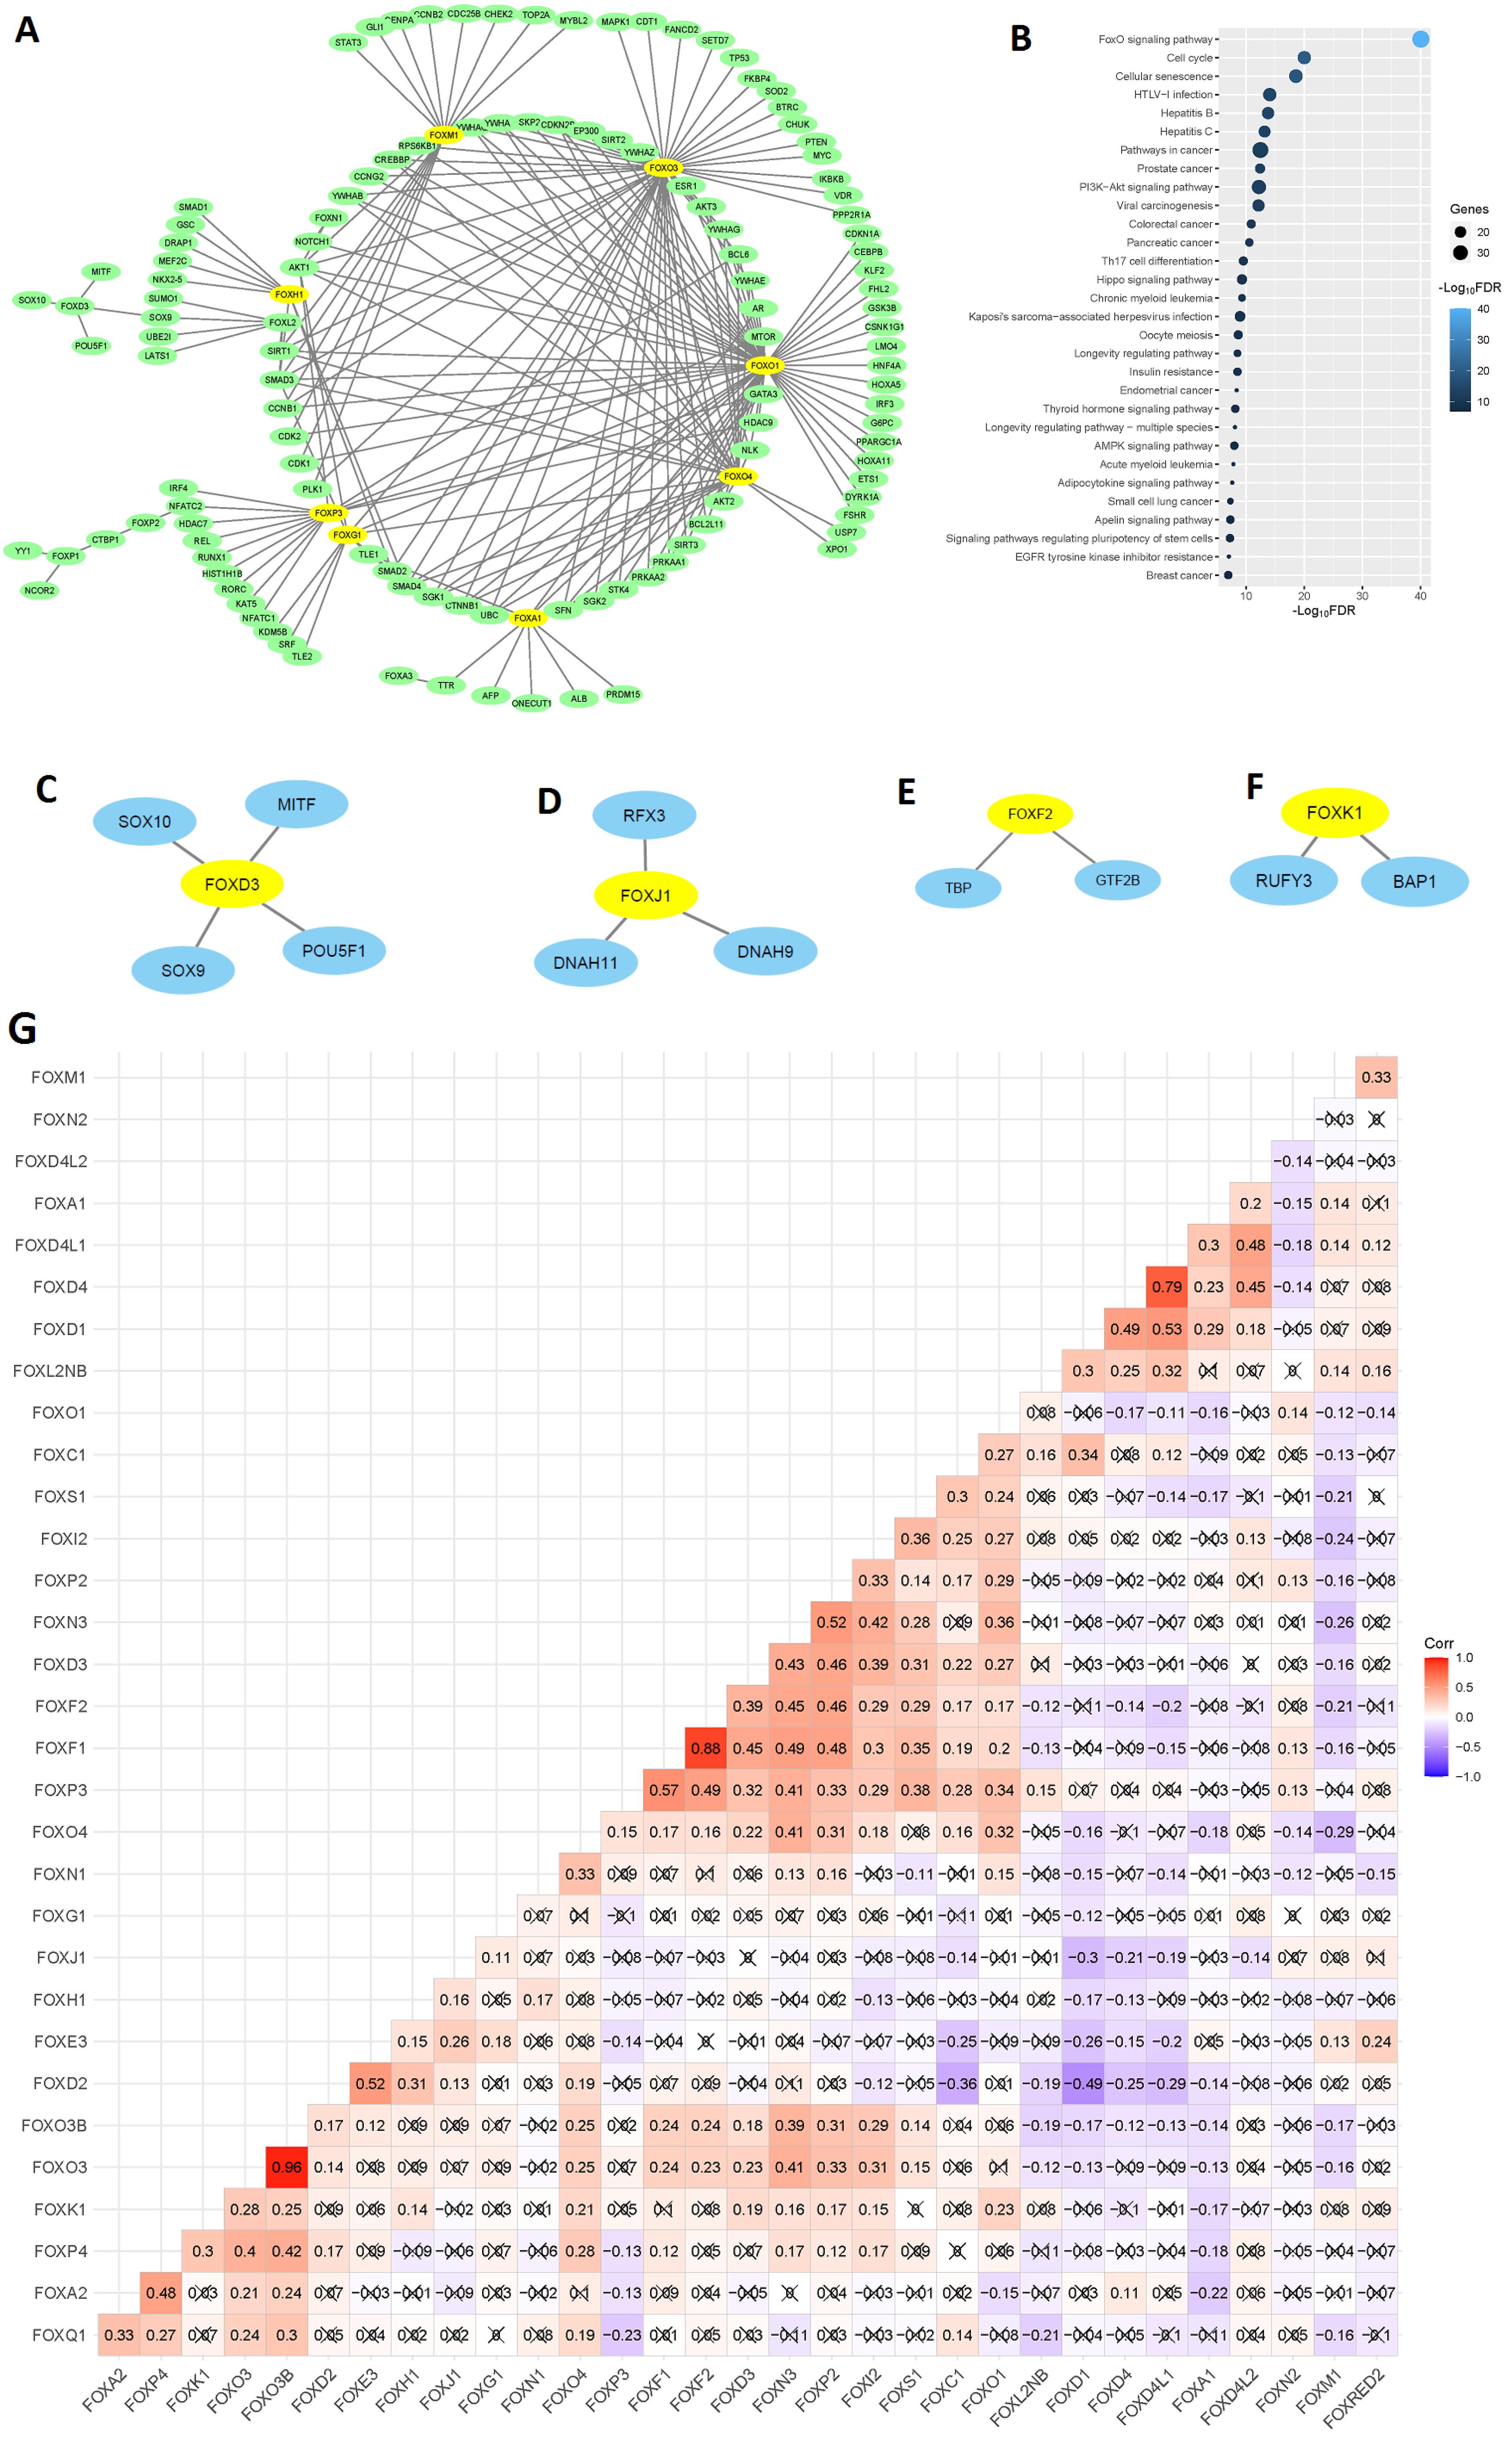
Figure 3.
Involvement of FOX Genes in the PPI Network and the Relationship of FOX Genes with Other Family Members. A. Involvement of FOX genes in the PPI (sub-network 1) network. B. The top 30 KEGG pathways are considerably enriched and connected to sub-network 1. C-F. The other four sub-networks of FOX genes in the PPI. G. Relationship between FOX genes in the TCGA COAD data (Pearson correlation test). × represents the non-significant value (P > 0.05)
.
Involvement of FOX Genes in the PPI Network and the Relationship of FOX Genes with Other Family Members. A. Involvement of FOX genes in the PPI (sub-network 1) network. B. The top 30 KEGG pathways are considerably enriched and connected to sub-network 1. C-F. The other four sub-networks of FOX genes in the PPI. G. Relationship between FOX genes in the TCGA COAD data (Pearson correlation test). × represents the non-significant value (P > 0.05)
Dysfunctional FOX Genes Related to Poor Survival Prognosis in the COAD
We investigated the survival prognosis of dysfunctional FOX genes (shown in Table 1) using the clinical information of the TCGA COAD cohort. We discovered that patients with COAD had a worse OS prognosis when the expression level of FOXC1, FOXD1, FOXD4, FOXD4L2, FOXH1, FOXQ1, and FOXS1 is higher than the median (HEG) (Figure 4A). In contrast, the higher expression group (HEG > median) of FOXN1 has a favorable survival prognosis in COAD patients (Figure 4A). In addition, the higher expression group (HEG > median) of FOXC1 and FOXD4L2 are poorly linked with DFS time in COAD patients (Figure 4B).
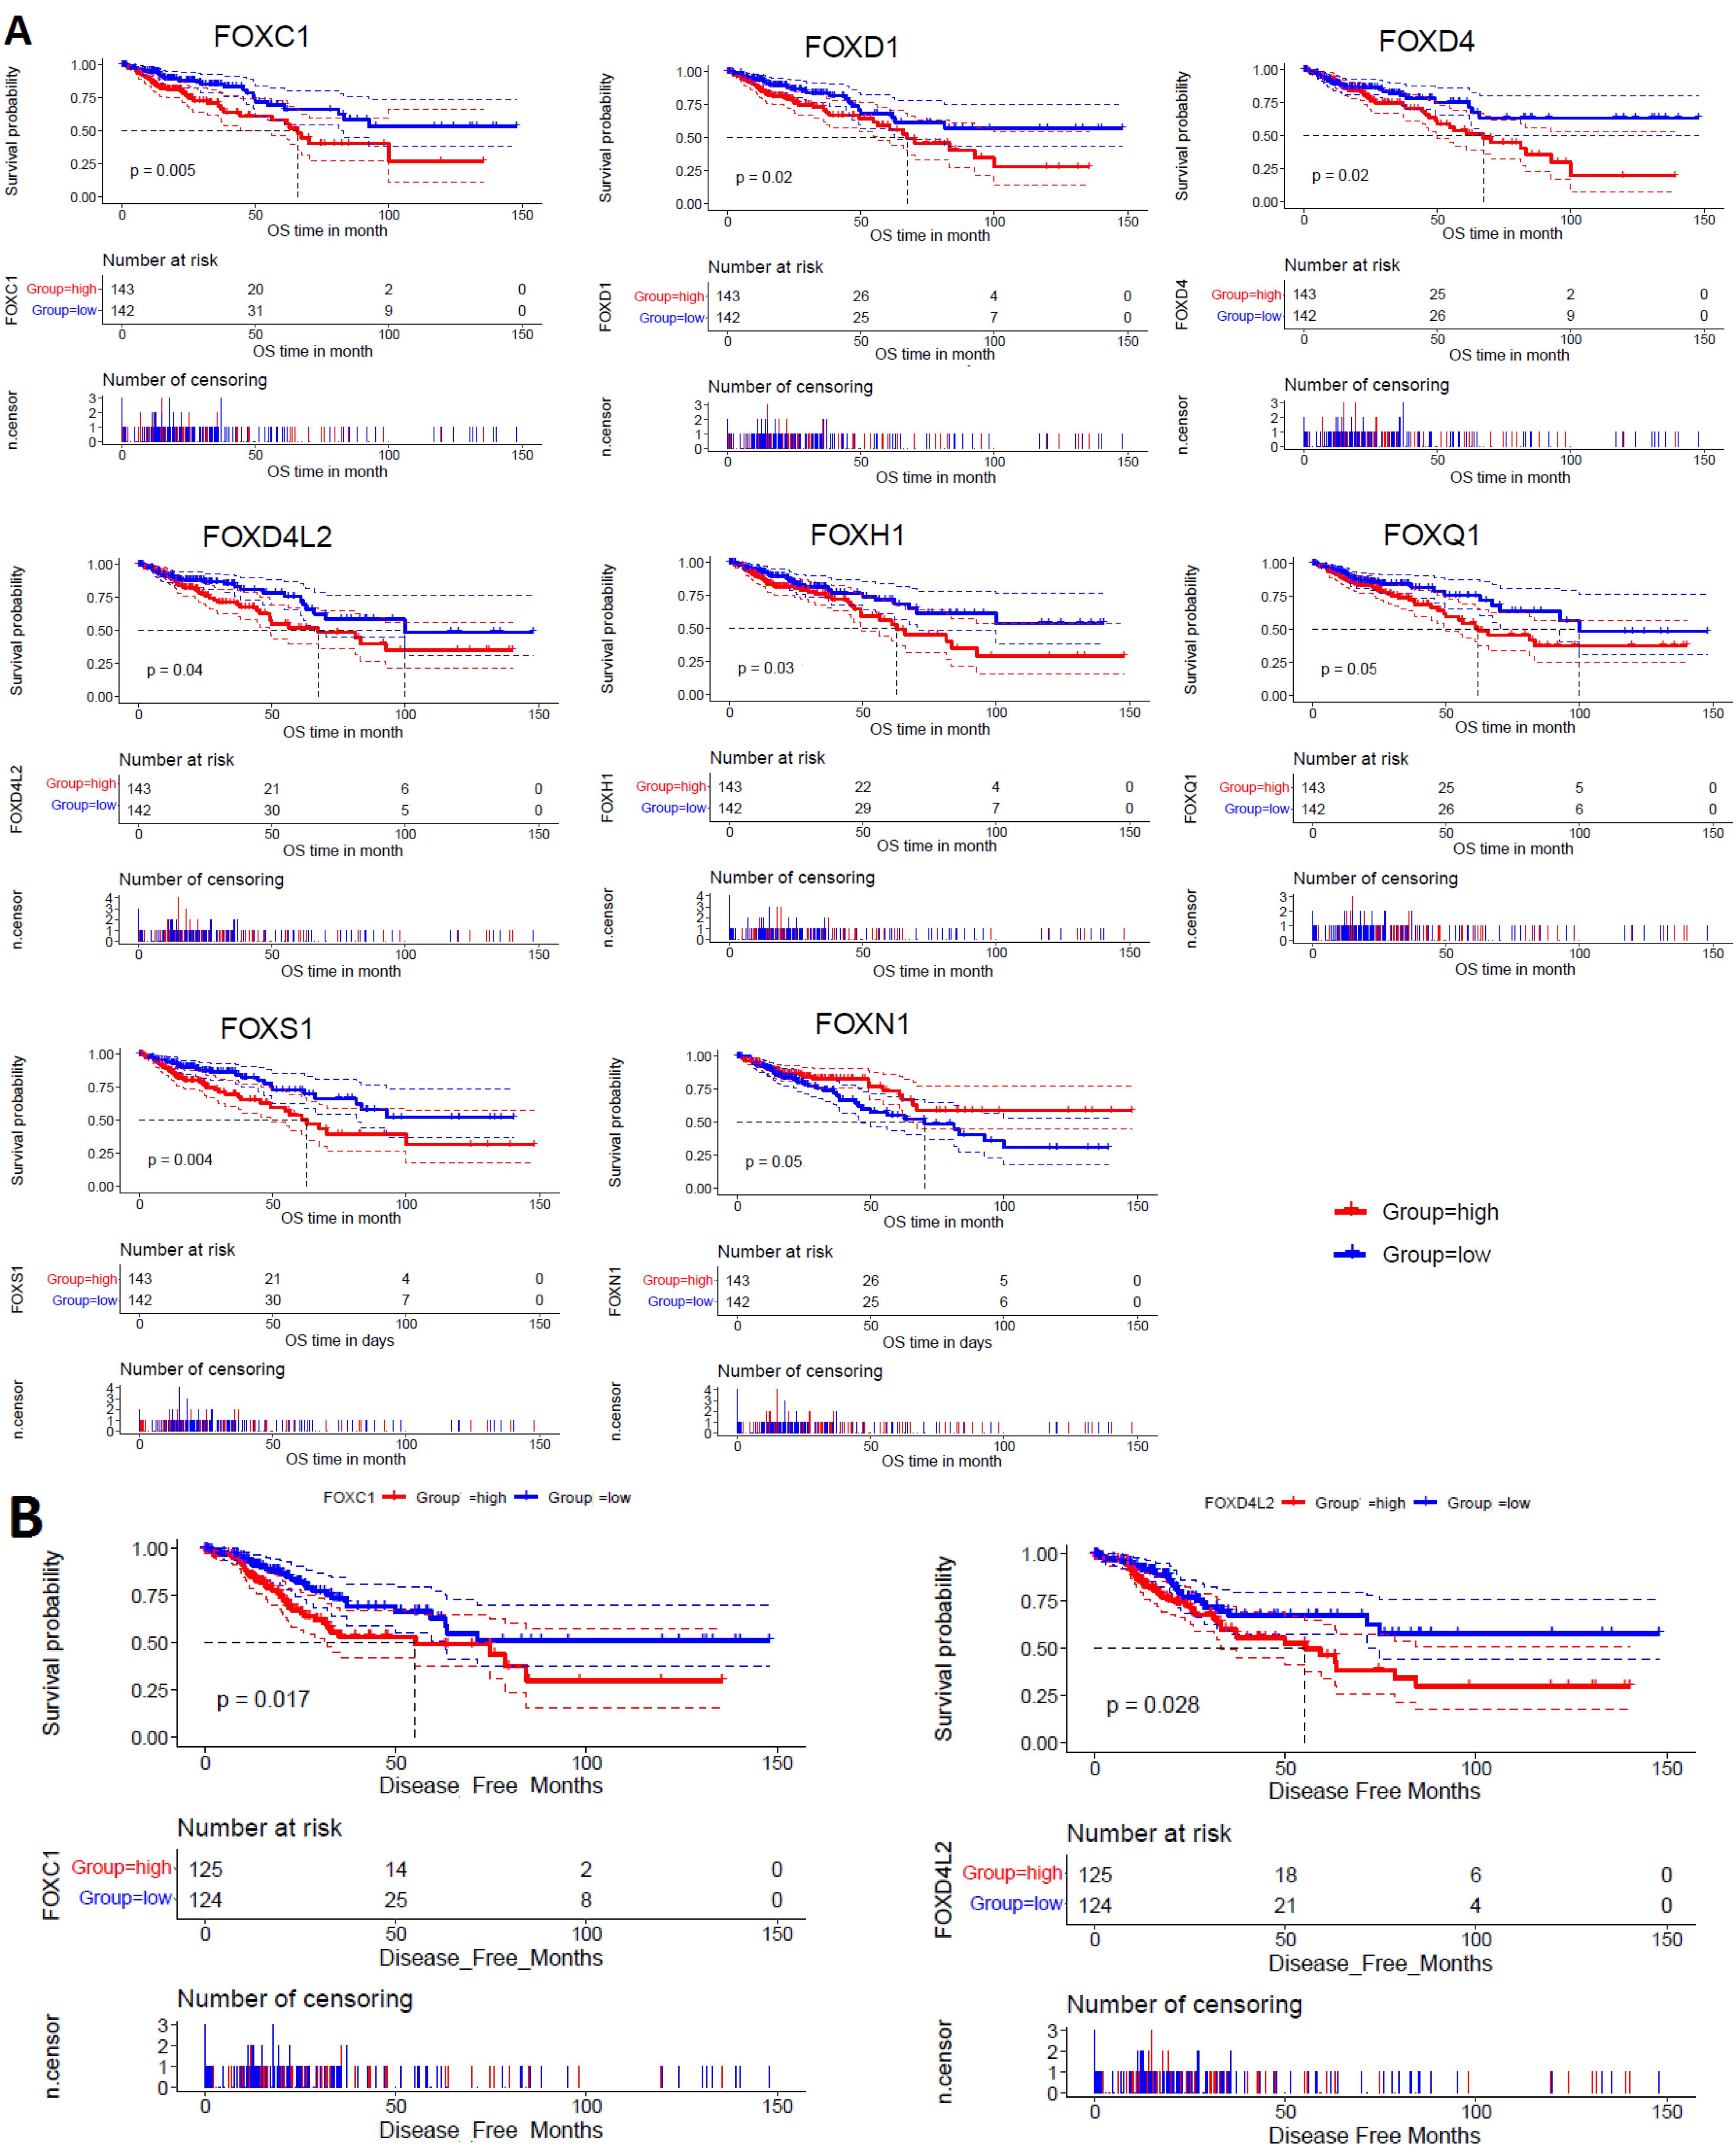
Figure 4.
Exploration of Prognostic FOX Genes in the COAD. A. The HEG patients of FOXC1, FOXD1, FOXD4, FOXD4L2, FOXH1, FOXQ1, and FOXS1 showed a substantially poor OS rate in COAD. The LEG patients of FOXN1 showed a substantially poor OS rate in COAD. B. The HEG patients of FOXC1 and FOXD4L2 showed a substantially shorter DFS rate in COAD
.
Exploration of Prognostic FOX Genes in the COAD. A. The HEG patients of FOXC1, FOXD1, FOXD4, FOXD4L2, FOXH1, FOXQ1, and FOXS1 showed a substantially poor OS rate in COAD. The LEG patients of FOXN1 showed a substantially poor OS rate in COAD. B. The HEG patients of FOXC1 and FOXD4L2 showed a substantially shorter DFS rate in COAD
Moreover, we applied univariate Cox regression analyses of the expression of seven prognostic genes (FOXC1, FOXD1, FOXD4, FOXD4L2, FOXH1, FOXQ1, and FOXS1), age, sex, weight, stage, and genome fraction altered. The univariate Cox regression analyses identified five genes (FOXC1, FOXD1, FOXD4, FOXH1, and FOXS1), stage, and fraction genome alteredas significant prognostic factors (Figure 5A). Furthermore, we investigated the multivariable Cox model with the levels of FOXC1, FOXD1, FOXD4, FOXH1, and FOXS1 genes, with COAD stage (stage I and stage II versus stage III and stage IV), and fraction genome altered as the predictor variables. Remarkably, we discovered that stage, fraction genome alterations, and the levels of three genes (FOXD4, FOXH1, and FOXS1) were the independent prognostic variables (Figure 5B). Finally, the nomogram was constructed to determine the possibility of these three prognostic FOX genes and stages of the tumor with fraction genome alterations influencing the prognostic outcome (Figure 5C).
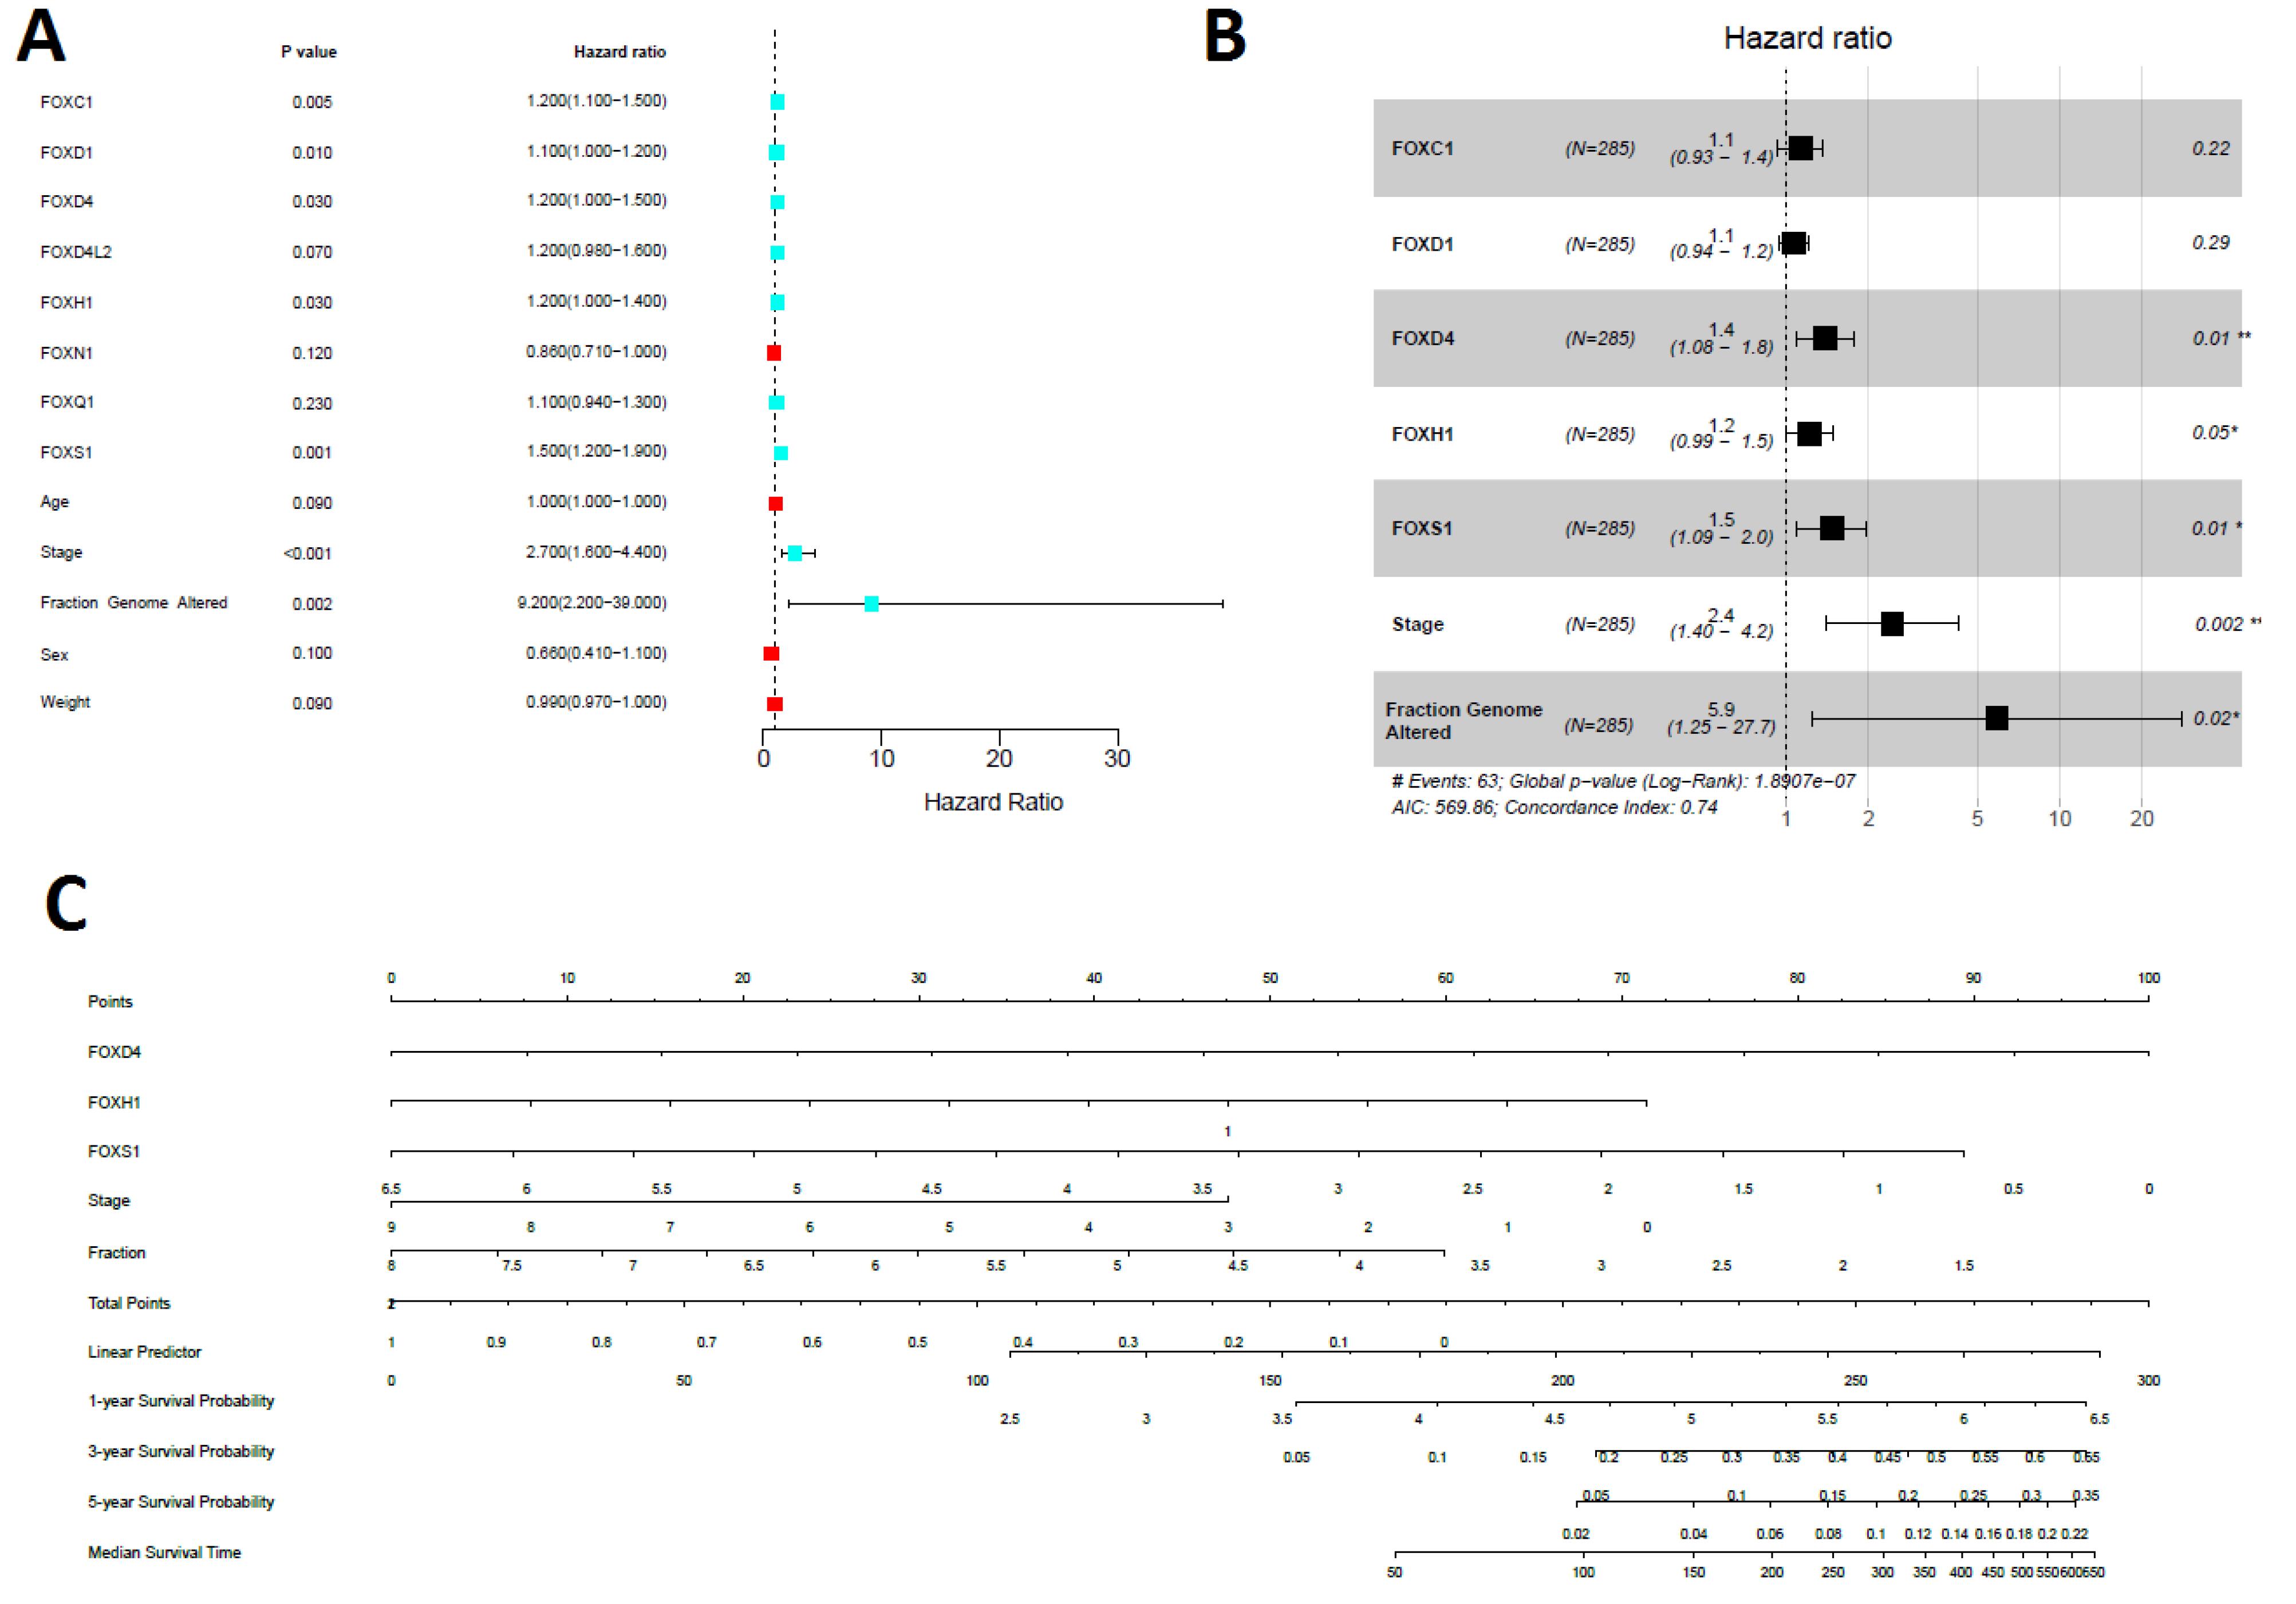
Figure 5.
Univariate and Multivariable Analysis of OS for Identifying the Prognostic Factors Associated with Nomogram Prediction. A. The univariate Cox model explored the risk factors in COAD, including FOXC1, FOXD1, FOXD4, FOXH1, and FOXS1. B. The multivariable Cox found that the stage, fraction genome altered, FOXD4, FOXH1, and FOXS1 are risk factors in COAD. C. Identifying the risk factors in the constructed nomogram. The nomogram predicted COAD’s 1, 2, and 3 years OS. Fraction = fraction genome alterations
.
Univariate and Multivariable Analysis of OS for Identifying the Prognostic Factors Associated with Nomogram Prediction. A. The univariate Cox model explored the risk factors in COAD, including FOXC1, FOXD1, FOXD4, FOXH1, and FOXS1. B. The multivariable Cox found that the stage, fraction genome altered, FOXD4, FOXH1, and FOXS1 are risk factors in COAD. C. Identifying the risk factors in the constructed nomogram. The nomogram predicted COAD’s 1, 2, and 3 years OS. Fraction = fraction genome alterations
The Dysfunctional Prognostic FOX Genes Regulating the Tumor Immunity in the COAD
In human CRC, the level of tumor-infiltrating lymphocytes (TILs) is a remarkable indicator of eventual survival.32 We investigated how the prognostic FOX markers FOXD4, FOXH1, and FOXS1 correlated with the immune scores, stromal scores, tumor purity, and TIL quantities in the TCGA COAD. First, we found that the stromal scores, immune scores, and tumor purity are significantly deregulated (Wilcoxon sum rank test, P < 0.05) between the HEG and LEG of FOXH1 and FOXS1 (Figure 6A). However, the expression of FOXD4 is not significantly associated with these immune factors (Wilcoxon sum rank test, P < 0.05) (Figure 6A). Second, we investigated the correlation (Spearman correlation test, R > 0.20, P < 0.01) of these three independent prognostic factors (FOXD4, FOXH1, and FOXS1) with several immune signatures (Figure 6B). Our analysis revealed that FOXS1 level showed a positive relationship with different immune signatures, such as CAFs, endothelial cells, HLA genes, immune cell infiltrate genes, immune checkpoint genes, macrophages, M2 macrophages, MDSCs, neutrophils, pDCs, T cell exhaustion, TAM, Tfh, TILs, Treg, type I IFN response, and Type II IFN response (Spearman correlation test, R > 0.20, P < 0.01) (Figure 6B). The FOXH1 level showed a negative correlation with the CD8 + regulatory T cells score, cytolytic activity, NK cells, and T cell activation (Spearman correlation test, R > 0.20, P < 0.01). However, the FOXD4 level was not related to the tumor immunity in the COAD (Spearman correlation test, R > 0.20, P < 0.01) (Figure 6B). Third, based on the level of FOXH1 and FOXS1 genes, we found that the ratios of pro-/anti-inflammatory cytokines were lower in the HEG patients compared to the LEG patients (Wilcoxon sum rank test, P < 0.005) (Figure 6C). Fourth, we discovered a positive correlation between different immune-inhibitory hallmark markers and the level of FOXS1 expression in COAD (Pearson’s correlation test, R > 0.20, P < 0.05) (Table 2). Some of the immune-inhibitory prominent marks, including IL10, PD-1, PD-L1, PD-L2, CTLA4, HAVCR2, TIGIT, CXCL13, FAP, VIM, and POSTN, were positively correlated with the expression level of FOXS1 (Table 2). Altogether, our immunological investigations demonstrated that the overexpressed level of FOXH1 and FOXS1 is crucially related to the immunosuppression of the colon TME, which may provide a significant explanation for the oncogenic role of FOX genes.
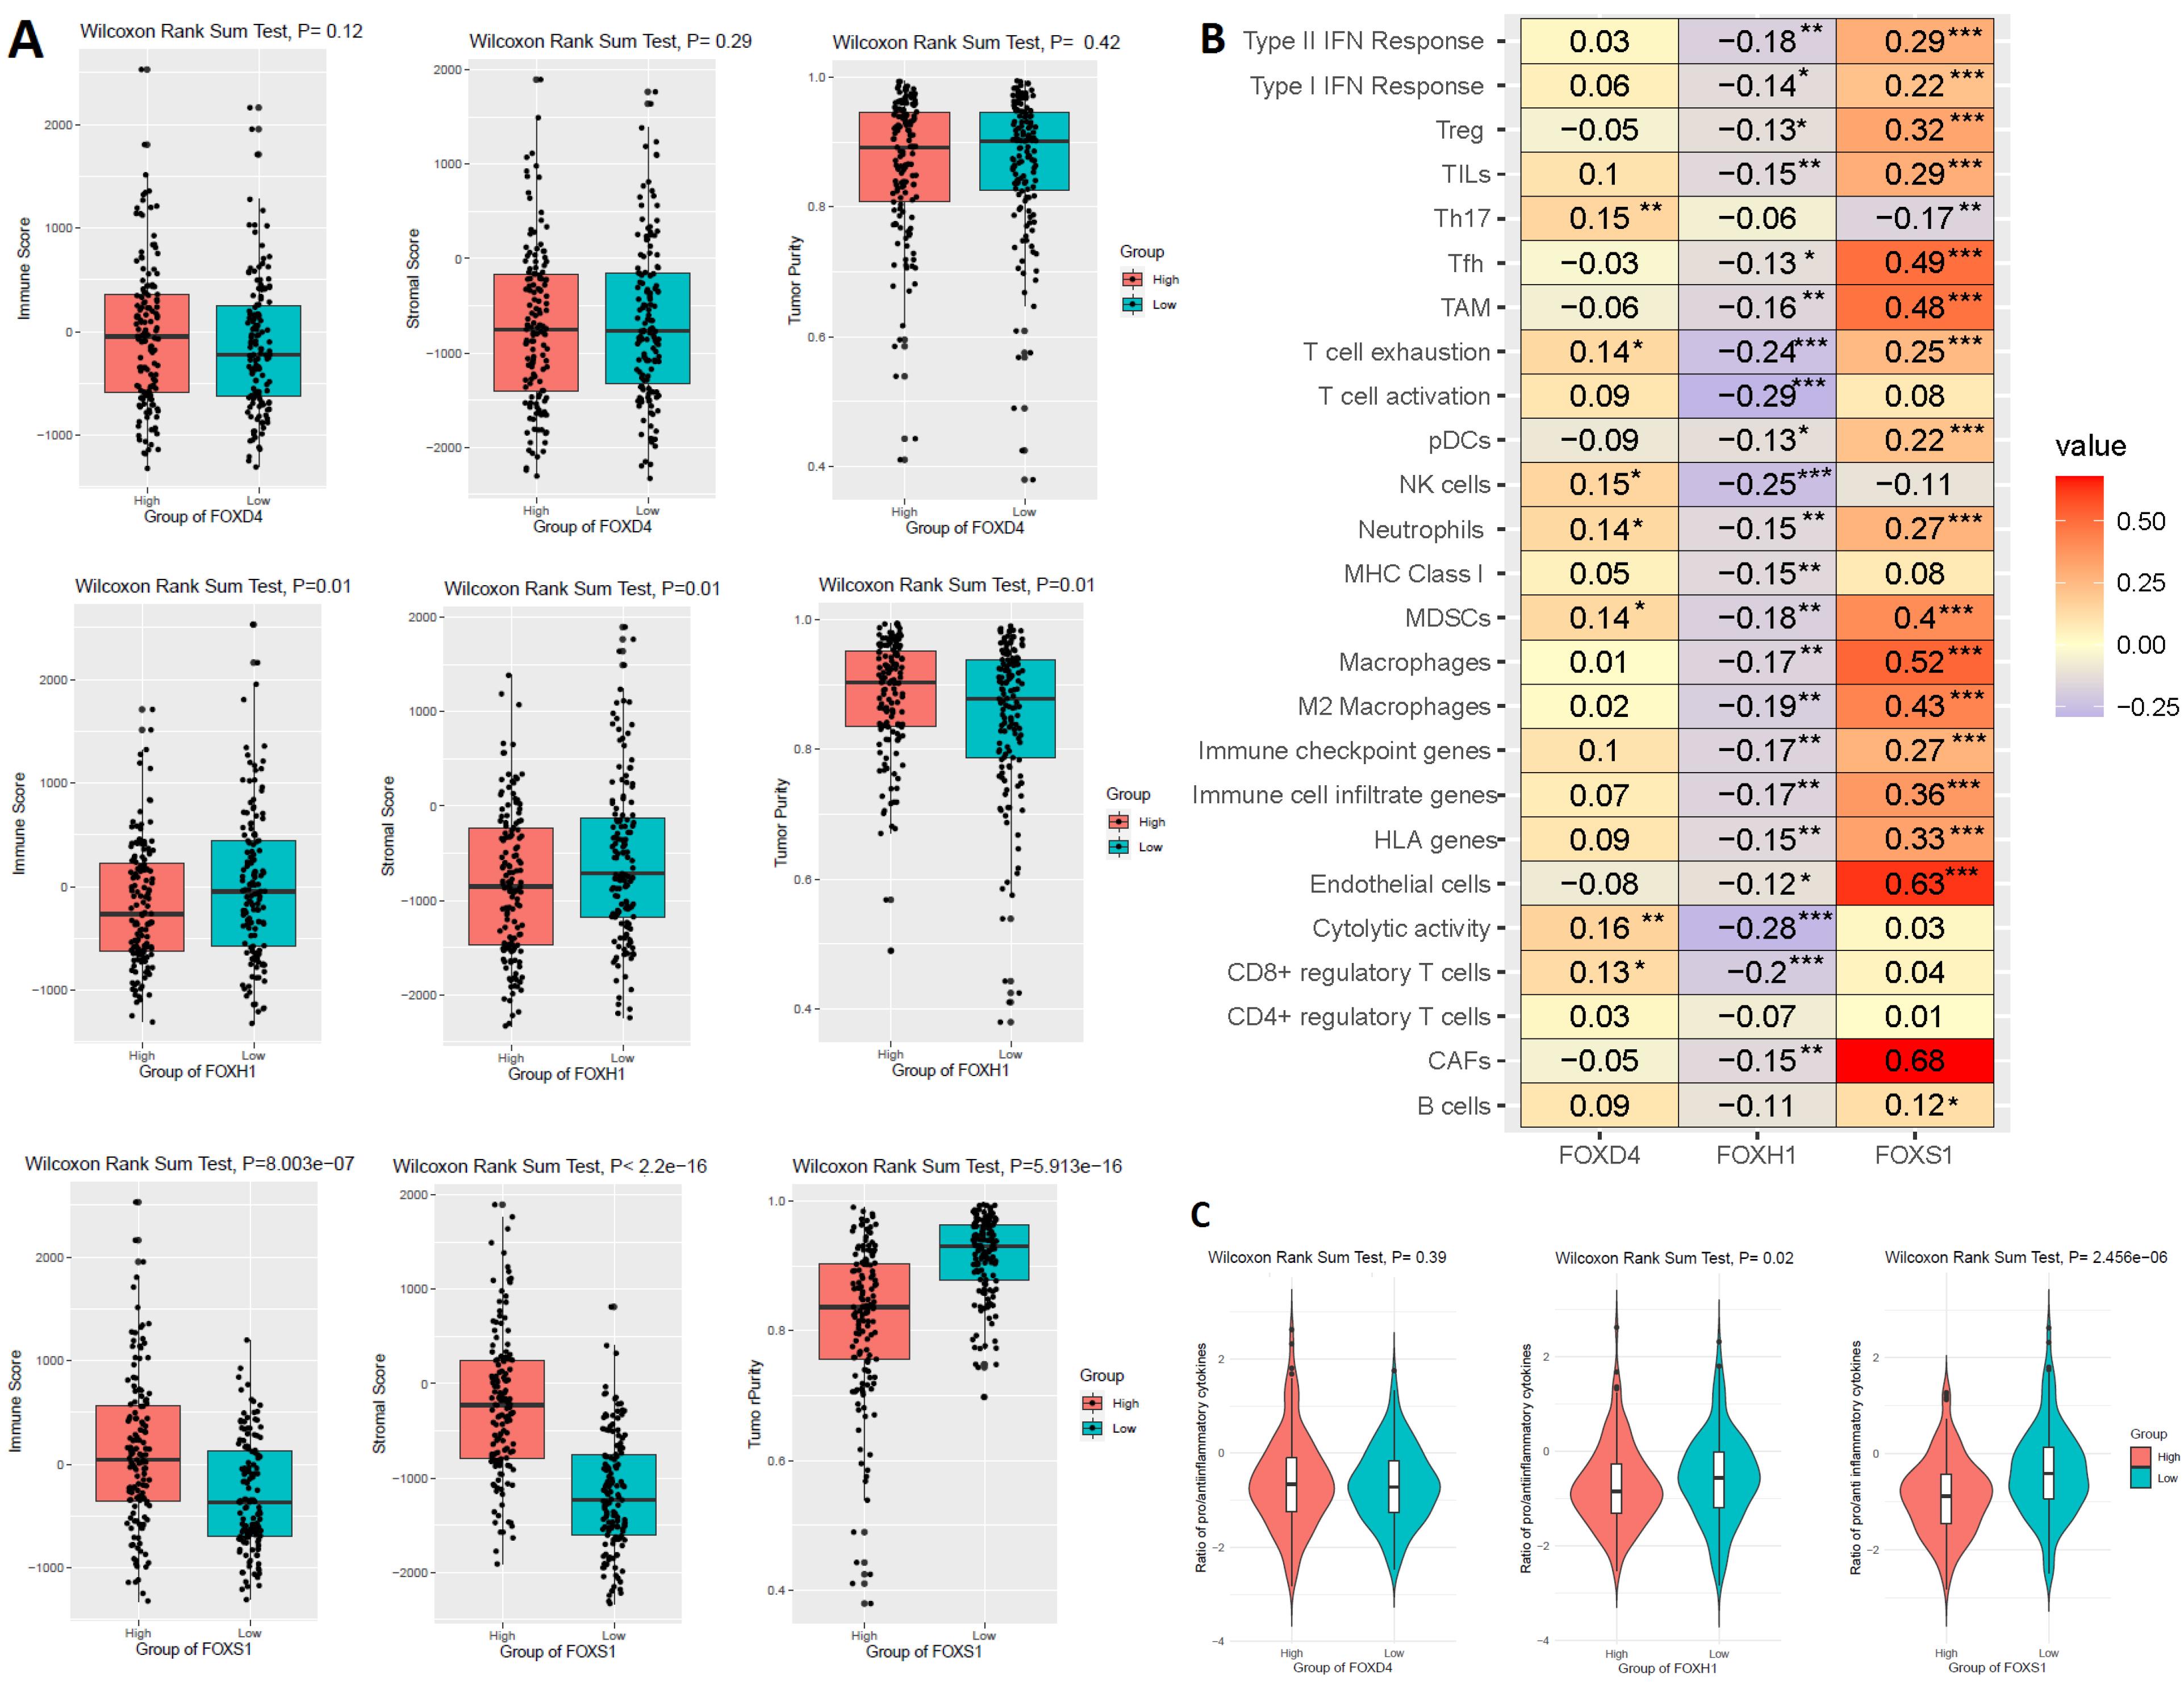
Figure 6.
Prognostic FOX Genes Correlated with the Regulation of Immunity in the COAD. A. Immune scores, stromal scores, and tumor purity are deregulated with the expression of prognostic FOX genes. B. The correlation of various immune cells with the prognostic FOX genes in the COAD. C. The ratios of pro-/anti-inflammatory cytokines were lower in the HEG patients compared to the LEG patients (Wilcoxon sum rank test, P < 0.005). We used the IFNG, IL-1A, IL-1B, and IL-2 marker genes as the pro-inflammatory cytokines and the IL-4, IL-10, IL-11, and TGFB1 marker genes as the anti-inflammatory cytokines27. * is P< 0.05, ** is P< 0.01, and *** is P < 0.001
.
Prognostic FOX Genes Correlated with the Regulation of Immunity in the COAD. A. Immune scores, stromal scores, and tumor purity are deregulated with the expression of prognostic FOX genes. B. The correlation of various immune cells with the prognostic FOX genes in the COAD. C. The ratios of pro-/anti-inflammatory cytokines were lower in the HEG patients compared to the LEG patients (Wilcoxon sum rank test, P < 0.005). We used the IFNG, IL-1A, IL-1B, and IL-2 marker genes as the pro-inflammatory cytokines and the IL-4, IL-10, IL-11, and TGFB1 marker genes as the anti-inflammatory cytokines27. * is P< 0.05, ** is P< 0.01, and *** is P < 0.001
Table 2.
The Independent Prognostic FOX Genes Correlated with Immunosuppressive Markers in the COAD
|
Immune Signature
|
Marker Gene
|
FOXD4
|
FOXH1
|
FOXS1
|
|
R
|
P
|
R
|
P
|
R
|
P
|
| TAM |
CCL2
|
-0.06 |
3.10E-01 |
-0.14 |
1.85E-02 |
0.61 |
1.19E-30 |
|
CD68
|
-0.03 |
6.41E-01 |
-0.08 |
1.71E-01 |
0.35 |
1.12E-09 |
|
IL10
|
0.01 |
8.53E-01 |
-0.11 |
7.09E-02 |
0.36 |
5.94E-10 |
| M2 Macrophage |
CD163
|
0.04 |
4.67E-01 |
-0.14 |
2.06E-02 |
0.46 |
2.07E-16 |
|
VSIG4
|
0.03 |
6.19E-01 |
-0.14 |
2.02E-02 |
0.54 |
6.73E-23 |
|
MS4A4A
|
0.06 |
3.39E-01 |
-0.14 |
1.43E-02 |
0.47 |
7.85E-17 |
| Treg |
FOXP3
|
0.04 |
5.43E-01 |
-0.05 |
4.13E-01 |
0.38 |
1.72E-11 |
|
CCR8
|
-0.02 |
7.17E-01 |
-0.07 |
2.54E-01 |
0.34 |
4.94E-09 |
|
TGFB1
|
0.15 |
1.37E-02 |
-0.11 |
6.07E-02 |
0.56 |
8.13E-25 |
| T cell exhaustion |
PD-1
|
0.17 |
3.60E-03 |
-0.14 |
2.03E-02 |
0.21 |
0.000393 |
|
PD-L1
|
0.13 |
2.48E-02 |
-0.17 |
3.91E-03 |
0.21 |
0.00028 |
|
PD-L2
|
0.06 |
3.35E-01 |
-0.17 |
3.98E-03 |
0.46 |
3.16E-16 |
|
CTLA4
|
0.18 |
2.58E-03 |
-0.07 |
2.44E-01 |
0.25 |
2.11E-05 |
|
HAVCR2
|
0.07 |
2.10E-01 |
-0.14 |
1.83E-02 |
0.49 |
3.96E-19 |
|
TIGIT
|
0.13 |
2.58E-02 |
-0.11 |
5.54E-02 |
0.24 |
2.76E-05 |
|
CXCL13
|
0.13 |
2.42E-02 |
-0.19 |
1.19E-03 |
0.21 |
2.89E-04 |
|
LAYN
|
-0.04 |
5.04E-01 |
-0.15 |
1.22E-02 |
0.67 |
2.27E-38 |
| Monocyte |
CD86
|
0.05 |
3.98E-01 |
-0.14 |
1.79E-02 |
0.45 |
1.73E-15 |
|
CD115
|
0.04 |
5.05E-01 |
-0.12 |
4.40E-02 |
0.51 |
1.50E-20 |
| CAFs |
COL1A1
|
0.00 |
9.67E-01 |
-0.13 |
2.30E-02 |
0.67 |
1.87E-39 |
|
COL1A2
|
-0.03 |
6.03E-01 |
-0.13 |
2.42E-02 |
0.68 |
2.17E-40 |
|
COL6A1
|
-0.02 |
7.49E-01 |
-0.17 |
3.04E-03 |
0.64 |
4.13E-34 |
|
COL6A2
|
-0.02 |
7.97E-01 |
-0.15 |
8.91E-03 |
0.70 |
6.93E-43 |
|
COL6A3
|
-0.05 |
4.43E-01 |
-0.13 |
2.57E-02 |
0.61 |
9.18E-31 |
|
CSPG4
|
-0.02 |
7.11E-01 |
-0.09 |
1.10E-01 |
0.53 |
2.77E-22 |
|
DCN
|
-0.09 |
1.29E-01 |
-0.14 |
1.96E-02 |
0.64 |
1.58E-34 |
|
DES
|
-0.10 |
9.91E-02 |
-0.06 |
3.15E-01 |
0.35 |
1.01E-09 |
|
FAP
|
0.01 |
8.38E-01 |
-0.16 |
5.90E-03 |
0.67 |
1.55E-38 |
|
TNC
|
0.00 |
9.81E-01 |
-0.18 |
2.63E-03 |
0.45 |
1.70E-15 |
|
ACTA2
|
-0.07 |
2.08E-01 |
-0.07 |
2.53E-01 |
0.73 |
3.17E-48 |
|
S100A4
|
0.00 |
9.83E-01 |
0.03 |
6.44E-01 |
0.34 |
2.60E-09 |
|
THY1
|
-0.03 |
5.97E-01 |
-0.11 |
5.21E-02 |
0.76 |
8.00E-55 |
|
VIM
|
0.01 |
9.05E-01 |
-0.14 |
1.53E-02 |
0.71 |
8.63E-45 |
|
POSTN
|
-0.01 |
8.49E-01 |
-0.18 |
2.58E-03 |
0.65 |
2.83E-35 |
| MDSCs |
IL18BP
|
0.09 |
1.20E-01 |
-0.07 |
2.21E-01 |
0.46 |
3.71E-16 |
|
FCGR2A
|
0.11 |
7.04E-02 |
-0.19 |
1.40E-03 |
0.48 |
4.41E-18 |
|
FCGR2B
|
0.05 |
3.65E-01 |
-0.09 |
1.16E-01 |
0.54 |
2.17E-23 |
|
FCGR3A
|
0.06 |
2.78E-01 |
-0.16 |
7.95E-03 |
0.54 |
1.86E-23 |
|
ITGAL
|
0.13 |
2.68E-02 |
-0.06 |
3.16E-01 |
0.33 |
1.39E-08 |
|
ITGAM
|
0.09 |
1.42E-01 |
-0.11 |
6.70E-02 |
0.53 |
1.19E-22 |
|
PSAP
|
0.02 |
7.26E-01 |
-0.12 |
3.91E-02 |
0.44 |
7.62E-15 |
|
S100A8
|
0.03 |
5.98E-01 |
-0.13 |
2.31E-02 |
0.33 |
8.48E-09 |
|
GPSM3
|
0.14 |
1.77E-02 |
-0.08 |
1.76E-01 |
0.41 |
4.14E-13 |
|
PARVG
|
0.12 |
4.99E-02 |
-0.01 |
8.38E-01 |
0.43 |
1.45E-14 |
|
CCR2
|
0.02 |
7.60E-01 |
-0.10 |
9.62E-02 |
0.43 |
4.65E-14 |
|
CXCR4
|
0.26 |
1.07E-05 |
-0.13 |
2.35E-02 |
0.33 |
1.68E-08 |
|
FERMT3
|
0.17 |
4.51E-03 |
-0.05 |
3.88E-01 |
0.35 |
1.41E-09 |
|
CD14
|
0.12 |
4.79E-02 |
-0.15 |
8.78E-03 |
0.52 |
6.81E-21 |
R is Pearson’s correlation, and P is significance level.
Prognostic FOX Genes Associated with Cancer-associated Pathways and Biological Processes in COAD
After we identified that the expression of three FOX genes (FOXD4, FOXH1, and FOXS1) are independent prognostic factors and regulate tumor immunity in COAD, we investigated the Spearman’s correlation of these three genes with various cancer-associated pathways activity (R > 0.20 and P < 0.01). Interestingly, we discovered a favorable correlation between the level of FOXS1 expression and the activities of several pathways, such as colorectal cancer, ECM receptor interaction, ERBB, Focal adhesion, Hippo, JAK-STAT, MAPK, mTOR, Notch, Pathways in cancer, TGF beta, VEGF, WNT, and Hedgehog signaling pathway (Figure 7A). In contrast, the level of FOXS1 in COAD is inversely linked with cell cycle activity (Figure 7A). Moreover, we studied the association between the expression of these three distinct prognostic variables and biological processes associated with cancer, such as EMT, angiogenesis, and hypoxia. We revealed a favorable correlation between EMT, angiogenesis, hypoxia, and the level of FOXS1 in COAD (Figure 7B). This implies that FOXS1 expression crucially controls the biological processes and mechanisms involved with malignancy in COAD.
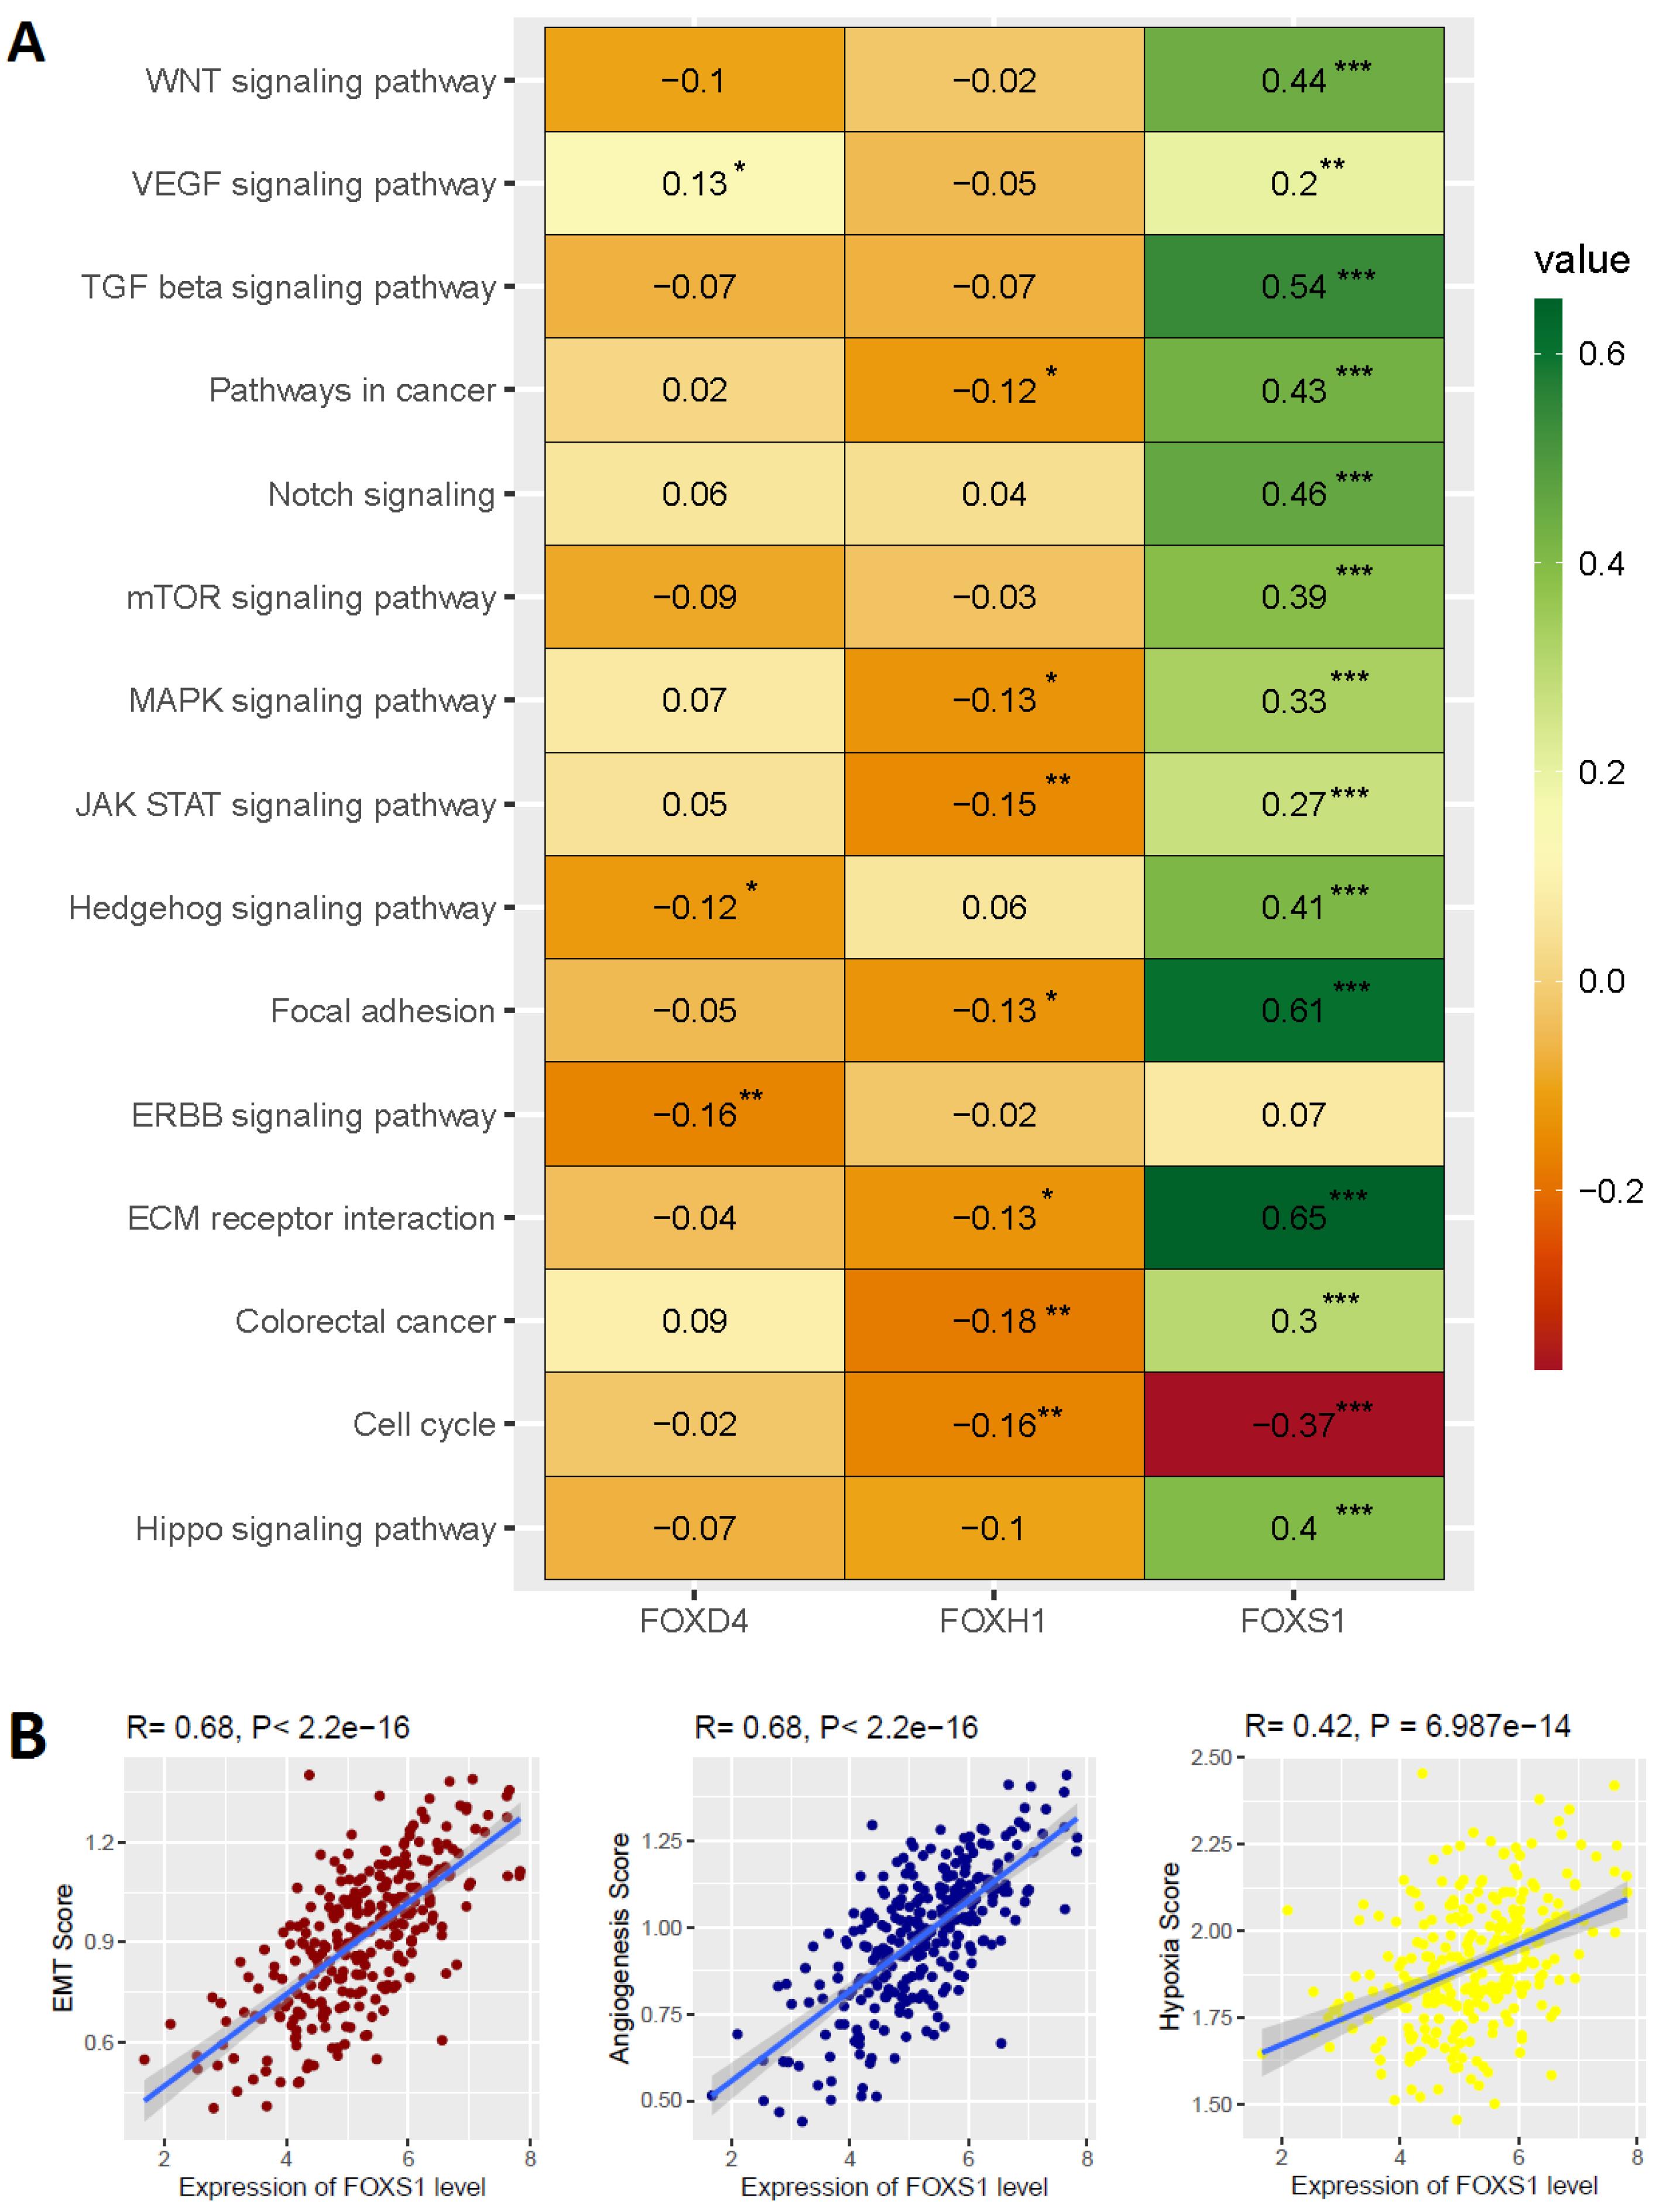
Figure 7.
Association of Biological Signaling with the Expression of Prognostic FOX Genes in COAD. A. The cancer-associated pathways are correlated with prognostic FOX genes. B. The hallmark biological processes, including EMT, angiogenesis, and hypoxia, correlate with the expression level of FOXS1. * is P < 0.05, ** is P < 0.01, and *** is P < 0.001
.
Association of Biological Signaling with the Expression of Prognostic FOX Genes in COAD. A. The cancer-associated pathways are correlated with prognostic FOX genes. B. The hallmark biological processes, including EMT, angiogenesis, and hypoxia, correlate with the expression level of FOXS1. * is P < 0.05, ** is P < 0.01, and *** is P < 0.001
Genetic Alteration of Prognostic FOX Genes in Colorectal Cancer
To identify the genetic changes of three prognostic FOX genes (FOXD4, FOXH1, and FOXS1), we utilized the COAD (TCGA, Firehose Legacy) datasets with mutation and CNA information (n = 220) in cBioPortal (http://www.cbioportal.org/). The 37 (17%) patient populations with the studied FOXD4, FOXH1, and FOXS1 genes showed genetic alterations. We revealed that FOXD4 was genetically changed in 2.7% of samples,and FOXH1 was genetically changed in 5% of samples (Figure 8A). In addition, FOXS1 was altered in 10% of patients (Figure 8A). The genetic changes mainly included amplification and missense mutation of three prognostic FOX genes (Figure 8A).
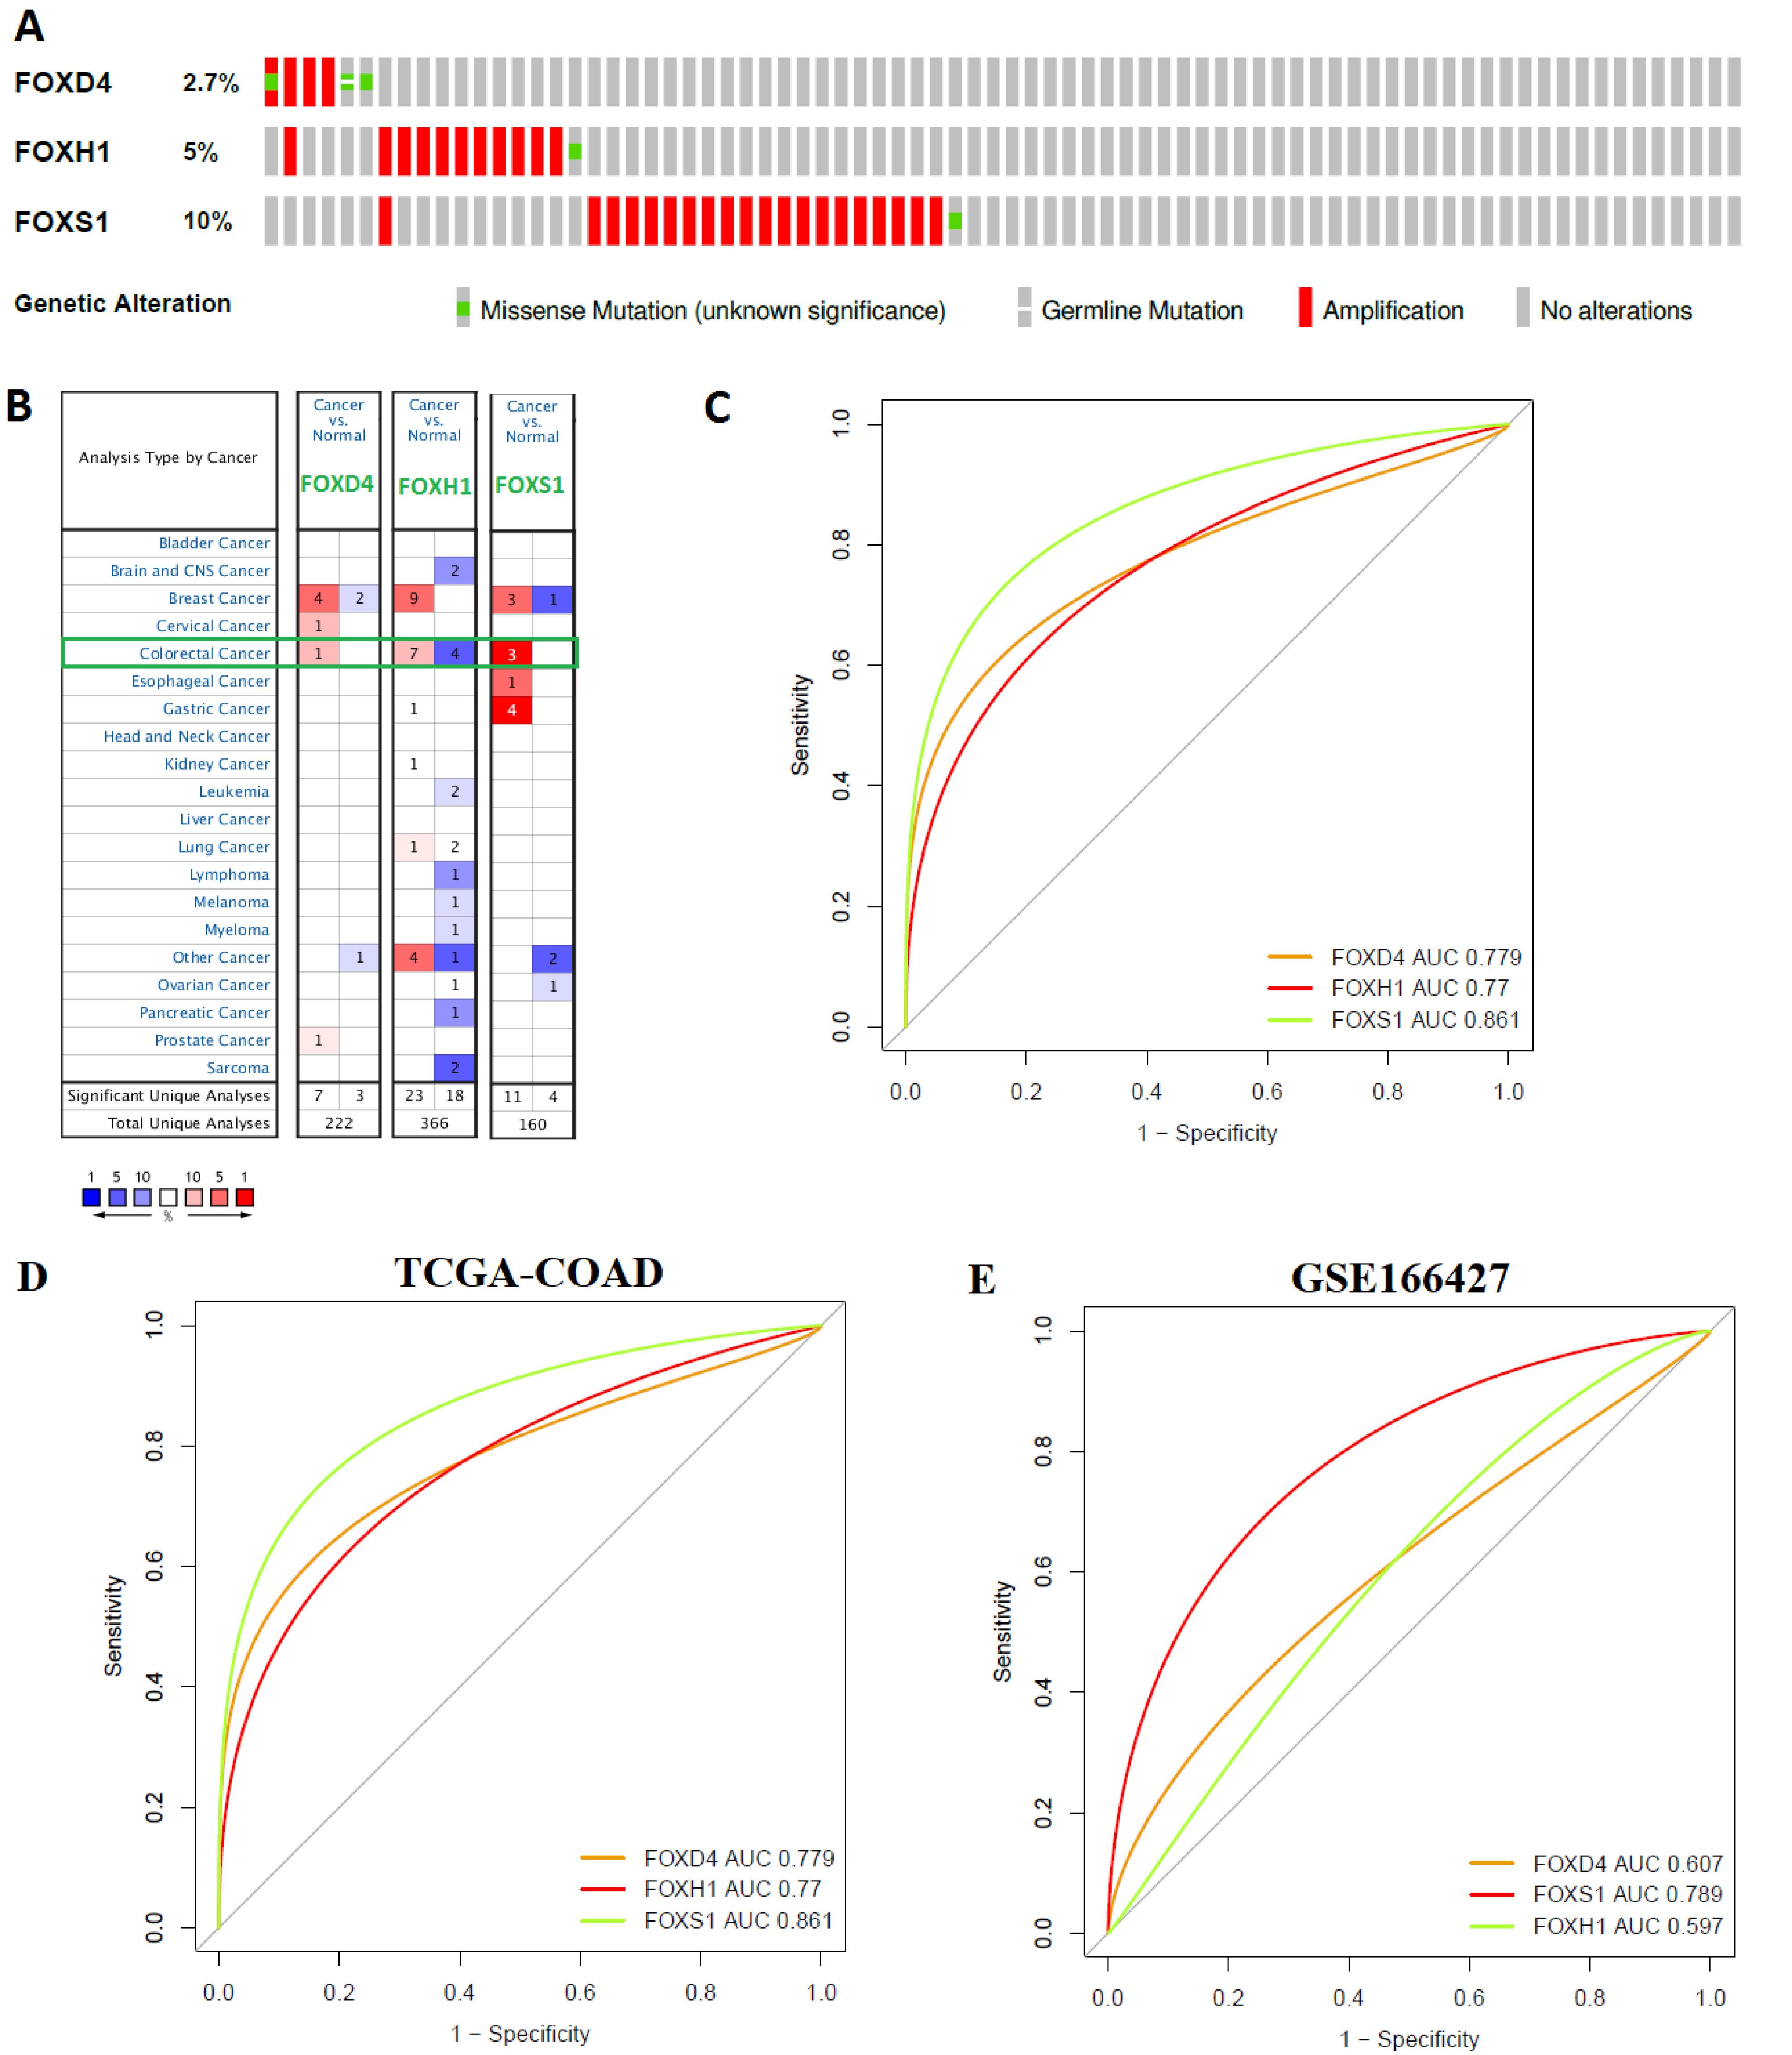
Figure 8.
Genetic Alterations, Expression Validation, and Diagnostic Efficacy of Prognostic FOX Genes in Colorectal Cancer. A. Genetical alterations of FOXD4, FOXH1, and FOXS1 in TCGA COAD cohort. The FOXD4 (2.7%), FOXH1 (5%), and FOXS1 (10 %) genes are mutated in COAD. B. mRNA expression of the FOXD4, FOXH1, and FOXS1 genes in different malignancies (results retrieved from the Oncomine repository). The fold change was set to 1.5, and P-value was set at 0.05. The value in the table indicates how many datasets meet the criteria. The extent of overexpression or decreased expression is linked with the strength of the color (red or blue). A light-green box indicated the mRNA deregulation of three prognostic genes. C. Consistent expression of FOXD4, FOXH1, and FOXS1 in GSE166427. D. Diagnostic efficacy of three prognostic FOX genes in TCGA-COAD.We sketched the receiver operating characteristic (ROC) curve of three prognostic genes in COAD and healthy samples. The value of FOXD4, FOXH1, and FOXS1 revealed diagnostic efficacy in the COAD. E. Consistent diagnostic efficacy of three prognostic FOX genes in GSE16642715
.
Genetic Alterations, Expression Validation, and Diagnostic Efficacy of Prognostic FOX Genes in Colorectal Cancer. A. Genetical alterations of FOXD4, FOXH1, and FOXS1 in TCGA COAD cohort. The FOXD4 (2.7%), FOXH1 (5%), and FOXS1 (10 %) genes are mutated in COAD. B. mRNA expression of the FOXD4, FOXH1, and FOXS1 genes in different malignancies (results retrieved from the Oncomine repository). The fold change was set to 1.5, and P-value was set at 0.05. The value in the table indicates how many datasets meet the criteria. The extent of overexpression or decreased expression is linked with the strength of the color (red or blue). A light-green box indicated the mRNA deregulation of three prognostic genes. C. Consistent expression of FOXD4, FOXH1, and FOXS1 in GSE166427. D. Diagnostic efficacy of three prognostic FOX genes in TCGA-COAD.We sketched the receiver operating characteristic (ROC) curve of three prognostic genes in COAD and healthy samples. The value of FOXD4, FOXH1, and FOXS1 revealed diagnostic efficacy in the COAD. E. Consistent diagnostic efficacy of three prognostic FOX genes in GSE16642715
Expression Evaluation and Diagnostic Efficacy of Prognostic FOX Genes in Colorectal Cancer
We examined the mRNA expression of three prognostic FOX genes (FOXD4, FOXH1, and FOXS1) in a variety of malignancies, including colorectal cancer, using the Oncomine repository (https://www.oncomine.org/resource/login.html) (Figure 1 and Table 1). The value of FOXD4, FOXH1, and FOXS1 were significantly up-regulated in colorectal cancer relative to the control (FC > 1.5 and P < 0.05) (Figure 8B). To validate the expression levels of these three genes, we used GSE16642715 to differentiate the expression level of FOXD4, FOXH1, and FOXS1 between the COAD and normal adjacent colon cells. Interestingly, we found that FOXD4, FOXH1, and FOXS1 are consistently deregulated in GSE16642715 (Figure 8C).
Since these three prognostic FOX gene members (FOXD4, FOXH1, and FOXS1) are key regulatory genes in COAD, we hypothesized that the three genes (FOXD4, FOXH1, and FOXS1) are useful for diagnosing COAD patients. We tested our stated hypothesis using the TCGA COAD dataset. For TCGA-COAD and healthy samples, the ROC curve of the expression levels of FOXD4 (AUC = 0.779), FOXH1 (AUC = 0.77), and FOXS1 (AUC = 0.861) displayed remarkable diagnostic significance (Figure 8D). Also, the ROC curve using the GSE166427 showed consistent diagnostic efficacy (Figure 8E).
Molecular Docking Studies Identified Potential FOX Genes Interacting with Drug Compounds
We inputted FOXD4, FOXH1, and FOXS1 genes into the NetworkAnalyst32 software for constructing the gene-compound interactions. We found that FOXH1 interacted with 4- (5-benzo(1,3)dioxol-5-yl-4-pyridin-2-yl-1H-imidazol-2-yl) benzamide, (6- (4-(2-piperidin-1-ylethoxy)phenyl))-3-pyridin-4-ylpyrazolo(1,5-a) pyrimidine, belinostat, carbamazepine, entinostat, panobinostat, phenylmercuric acetate, trichostatin A, valproic acid and zinc (Figure 9A). Also, FOXD4 and FOXS1 interacted with some other compounds or agents, including 3,4,5,3’,4’-pentachlorobiphenyl, aflatoxin B1, antirheumatic agents, calcitriol, ICG 001 (Foscenvivint), oxygen (Figure 9B). Then, we downloaded the protein structure of FOXH1 (5XOC) to identify the molecular interaction with the chemical compounds. Interestingly, we found that the FOXH1 (chain B of the crystal structure of human SMAD3-FOXH1 complex: 5XOC) binds with 4- (5-benzo(1,3)dioxol-5-yl-4-pyridin-2-yl-1H-imidazol-2-yl) benzamide, (6- (4-(2-piperidin-1-ylethoxy)phenyl))-3-pyridin-4-ylpyrazolo(1,5-a) pyrimidine, belinostat, carbamazepine, entinostat, panobinostat, and trichostatin A (Figure 9C). The binding affinity of these interactions is illustrated in Figure 9D.
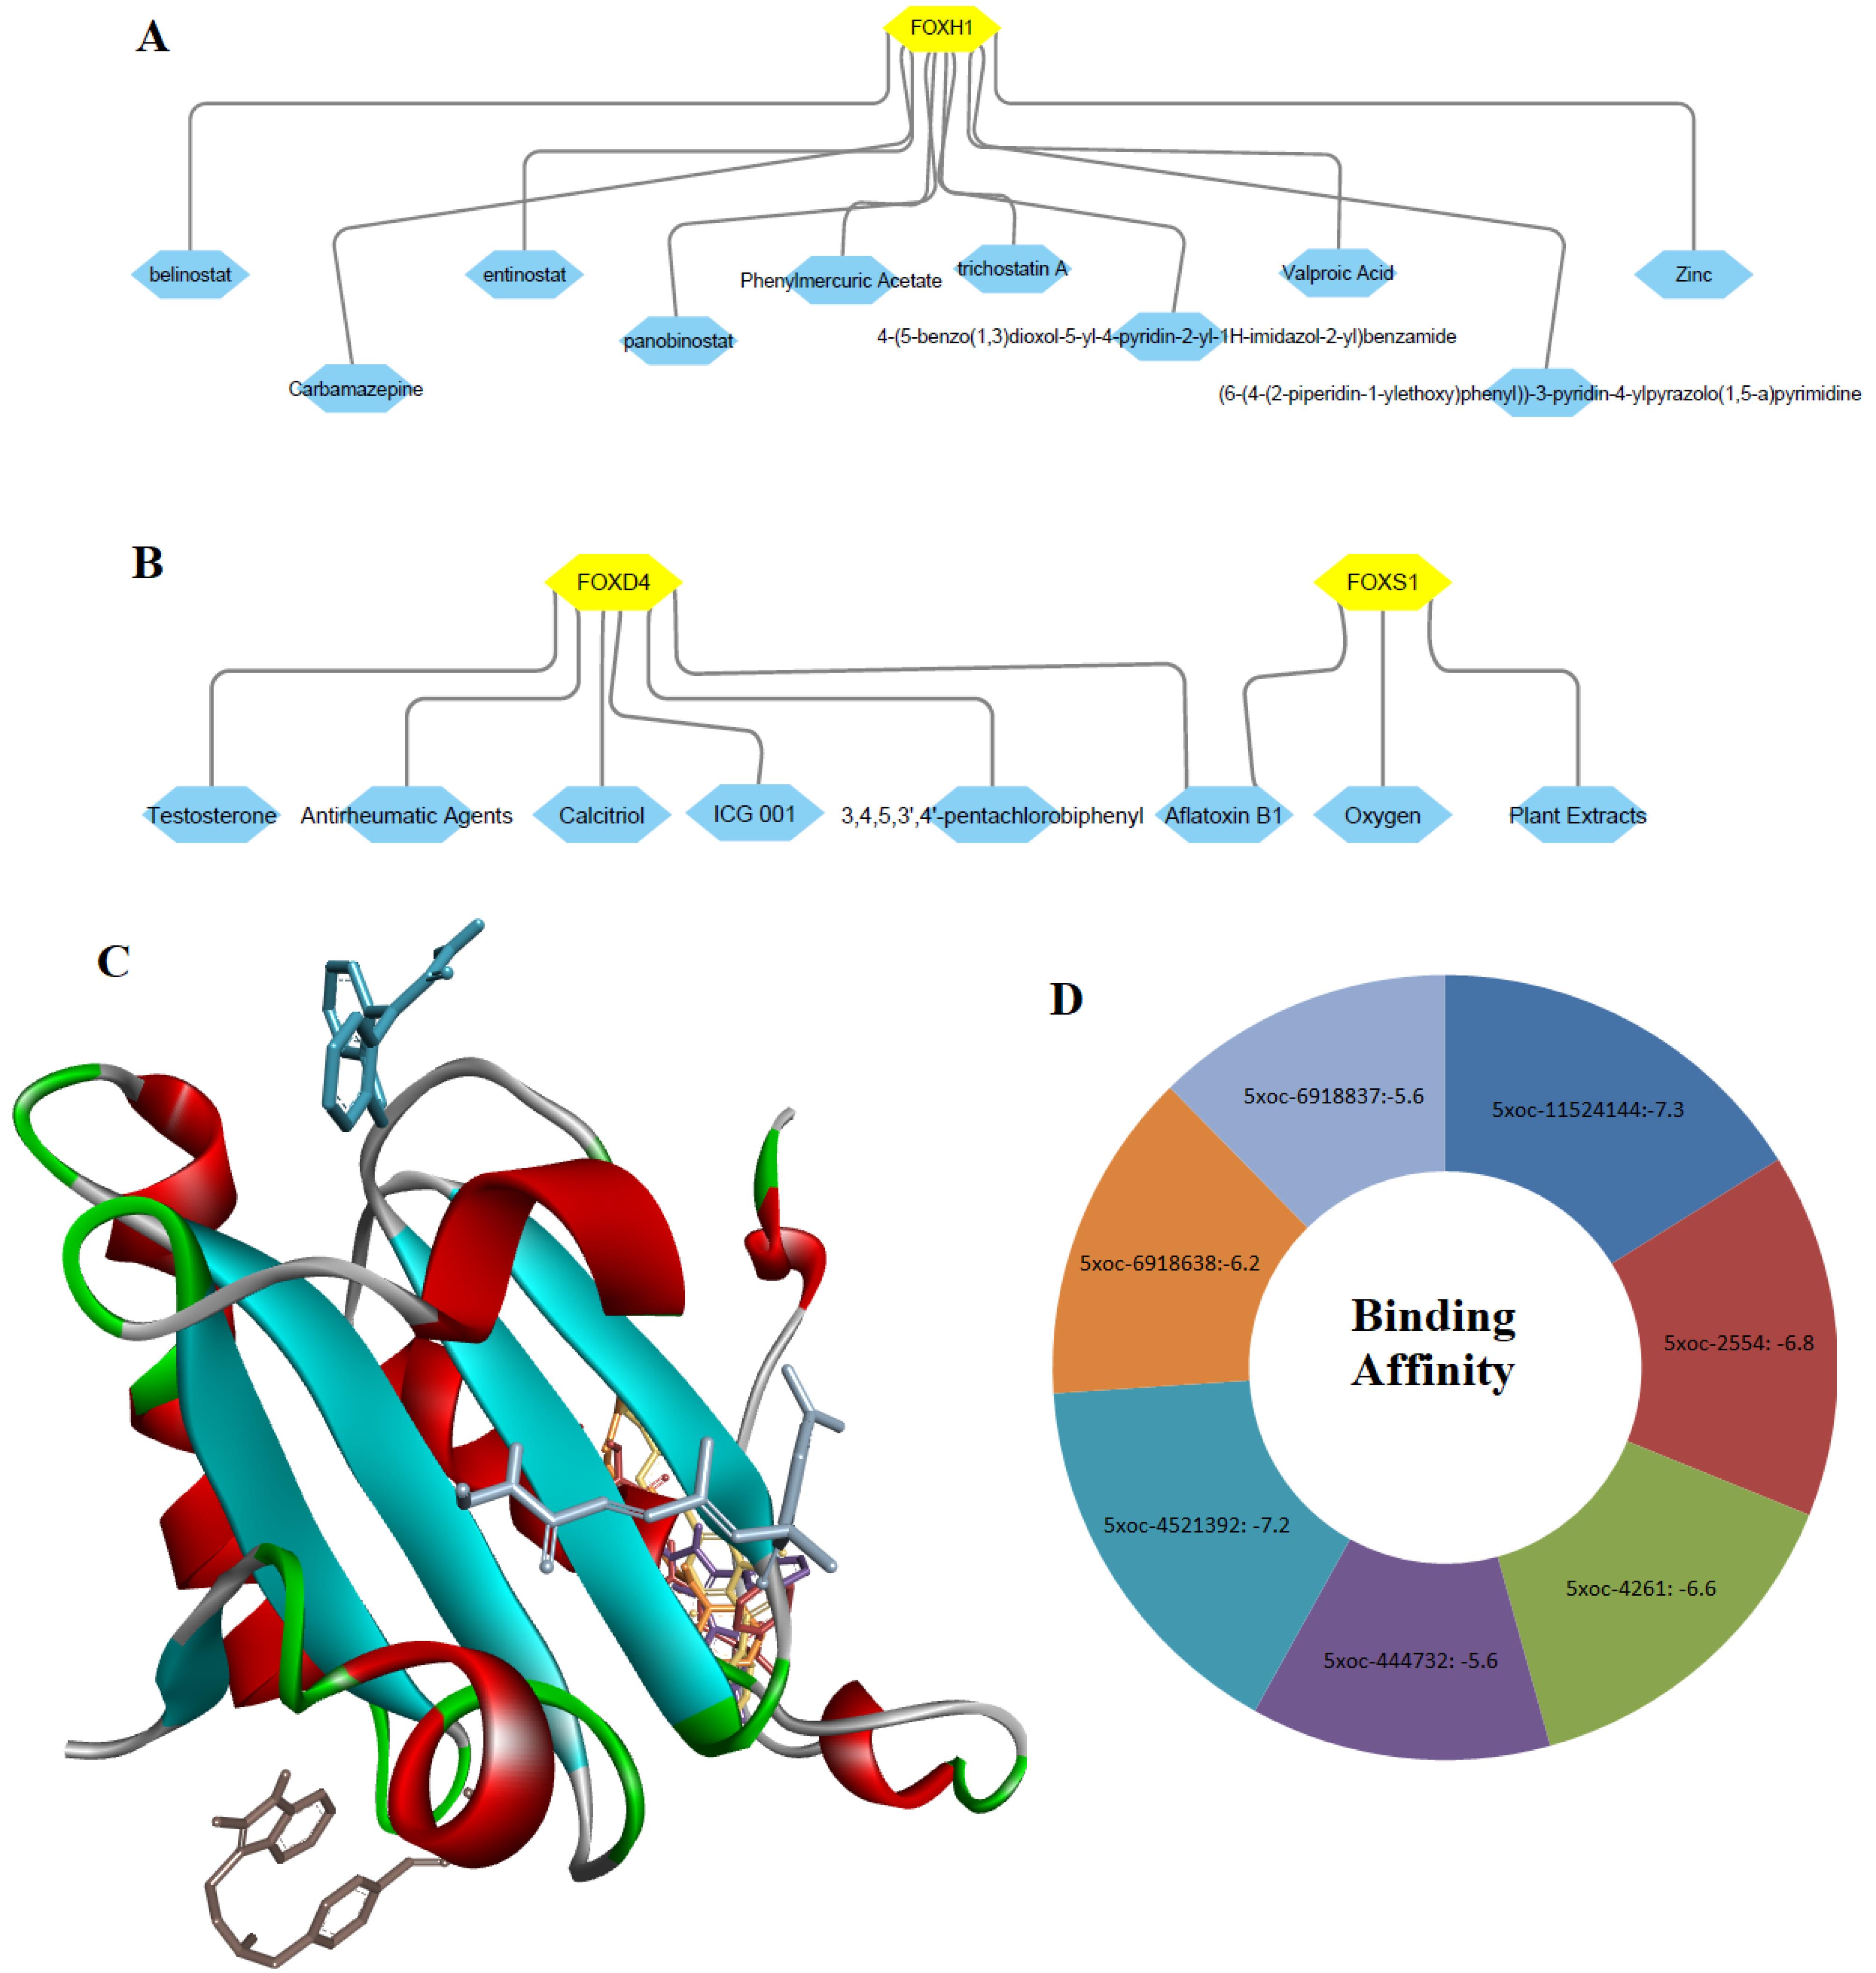
Figure 9.
Interaction of Key Genes and Chemical Compounds. A. FOXH1 interacted with various compounds. B. FOXD4 and FOXS1 interacted with some chemical compounds. C. Interaction of FOXH1 (chain B of the crystal structure of human SMAD3-FOXH1 complex: 5XOC) with chemical compounds. D. Binding affinity of interactions between the 5XOC (B chain of 5XOC) and chemical compounds. 5XOC: Crystal structure of human SMAD3-FOXH1 complex; 4521392: 4- (5-benzo(1,3)dioxol-5-yl-4-pyridin-2-yl-1H-imidazol-2-yl) benzamide; 11524144: (6- (4-(2-piperidin-1-ylethoxy)phenyl))-3-pyridin-4-ylpyrazolo(1,5-a) pyrimidine; 6918638: Belinostat; 2554: Carbamazepine; 4261: Entinostat; 6918837: Panobinostat; 444732: Trichostatin A
.
Interaction of Key Genes and Chemical Compounds. A. FOXH1 interacted with various compounds. B. FOXD4 and FOXS1 interacted with some chemical compounds. C. Interaction of FOXH1 (chain B of the crystal structure of human SMAD3-FOXH1 complex: 5XOC) with chemical compounds. D. Binding affinity of interactions between the 5XOC (B chain of 5XOC) and chemical compounds. 5XOC: Crystal structure of human SMAD3-FOXH1 complex; 4521392: 4- (5-benzo(1,3)dioxol-5-yl-4-pyridin-2-yl-1H-imidazol-2-yl) benzamide; 11524144: (6- (4-(2-piperidin-1-ylethoxy)phenyl))-3-pyridin-4-ylpyrazolo(1,5-a) pyrimidine; 6918638: Belinostat; 2554: Carbamazepine; 4261: Entinostat; 6918837: Panobinostat; 444732: Trichostatin A
Figure 10 displays the 3D and 2D interactions of FOXH1 with the compounds that targeted it. We revealed that panobinostat interacted with FOXH1 (The B chain of 5XOC) with an appreciable binding affinity of -5.6 kcal/mol. The three amino acid residues (LYS 214, THR 265, and ALA 233) of 5XOC interact with panobinostat (Figure 10). Moreover, the drug compound belinostat and entinostat potentially interacted with FOXH1 (the B chain of 5XOC) (Figure 10). Also, (6- (4-(2-piperidin-1-ylethoxy) phenyl))-3-pyridin-4-ylpyrazolo(1,5-a) pyrimidine interacted with six amino acid residues (GLU 312, ASP 315, ALA 316, ALA 319, LEU 330, and PRO 336) of 5XOC. Moreover, 4- (5-benzo(1,3)dioxol-5-yl-4-pyridin-2-yl-1H-imidazol-2-yl) benzamide interacted with the ASP 315, ALA 316, ALA 319, LEU 330, and PRO 336 residues of 5XOC. Trichostatin A interacted with the TYR 281 and VAL 297, and carbamazepine interacted with ILE 271, ALA 278, ARG 284, and ILE 286. We showed that the B chain of 5XOC interacted with various drug compounds through the carbon-hydrogen bond, conventional carbon-hydrogen bond, pi-anion bond, pi-sigma bond, alkyl bond, and pi-alkyl bond. It has been stated that panobinostat is potentially used to treat colorectal cancer.33 Belinostat, another interacting drug, potentially altered the proteomic signatures of colon cancer cells.34 Entinostat combined with immunological agents reduces tumor cells in multiple murine carcinoma models.35 Altogether, our results suggested that these potential drug-gene interactions could be used against the malignancies of COAD.
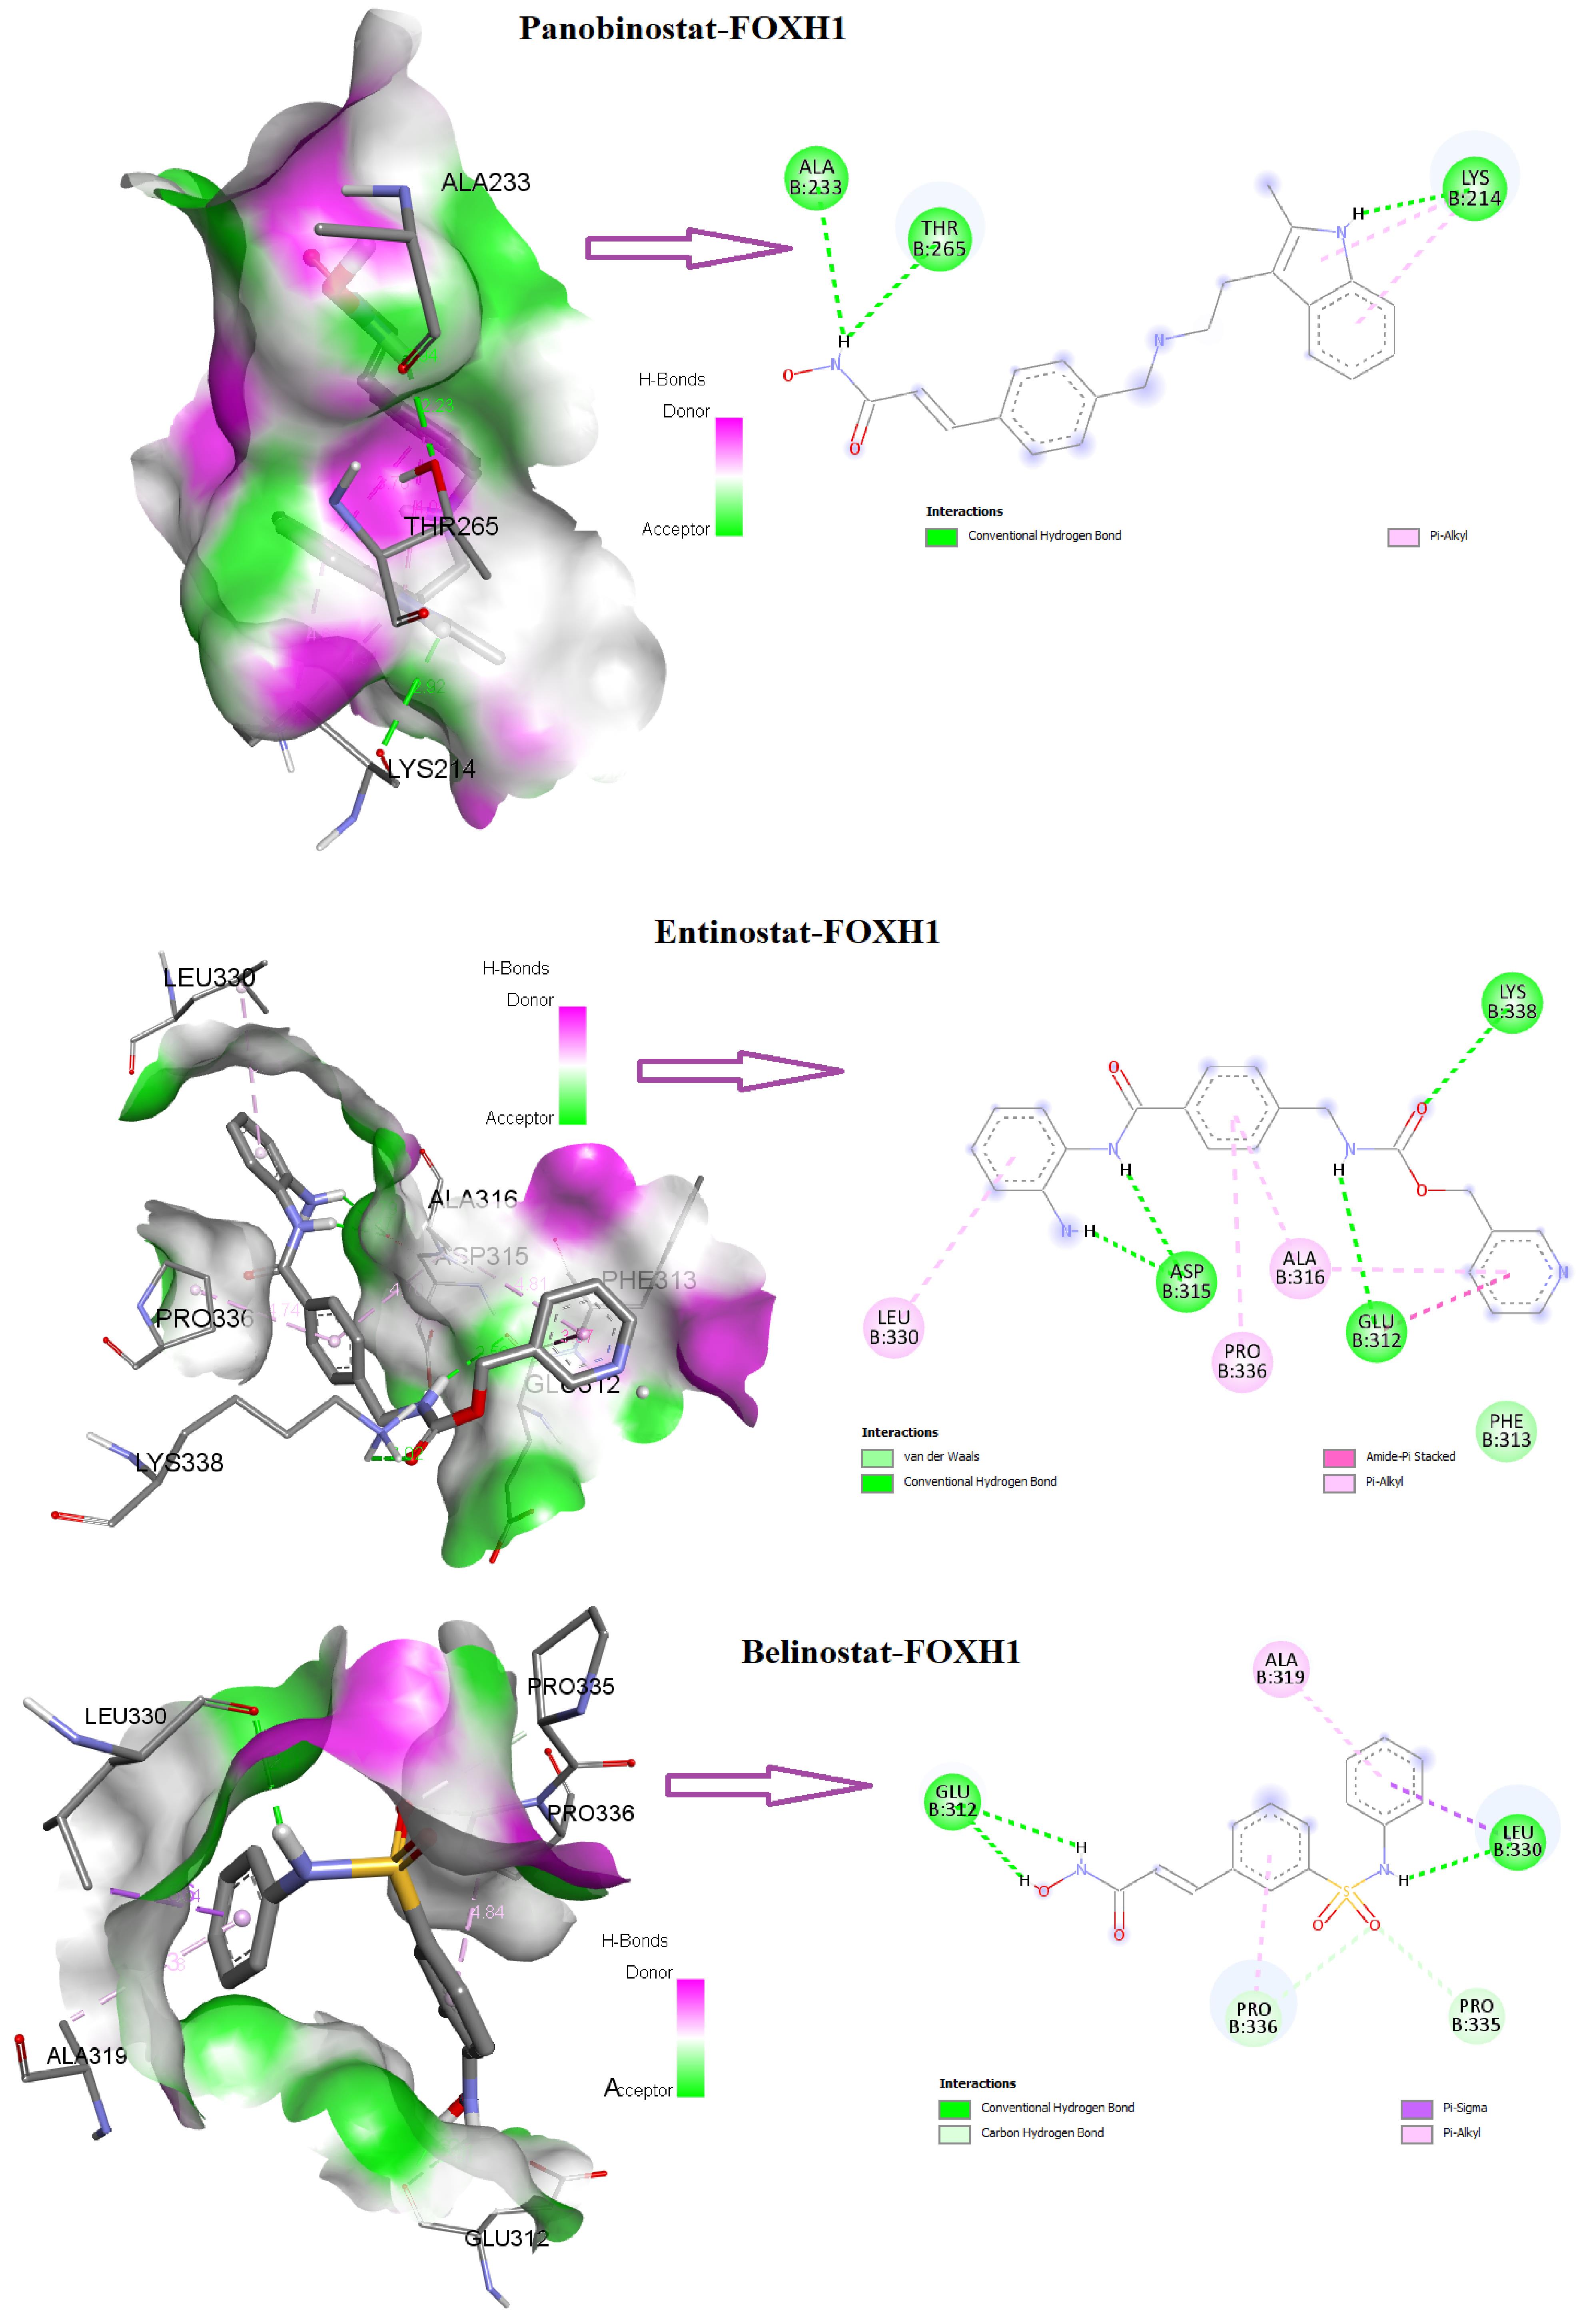
Figure 10.
Interaction of Panobinostat, Entinostat, and Belinostat with FOXH1 (B Chain of 5XOC) in Three-Dimensional and Two-Dimensional Approaches
.
Interaction of Panobinostat, Entinostat, and Belinostat with FOXH1 (B Chain of 5XOC) in Three-Dimensional and Two-Dimensional Approaches
Discussion
Colorectal cancer is the third leading diagnosed cancer with 9.4% of deaths worldwide.14 We conducted a thorough bioinformatics investigation to assess the oncogenic implications of altered FOX genes in COAD since they are linked to cancer onset, growth, advancement, migration, drug resistance, tumor immunity, and cancer-associated signaling pathways.2-5 Here, we explored the aberrant levels of FOX genes in COAD, the involvement of deregulated FOX genes in the functional enrichment, and the association of FOX genes in the PPI. Moreover, the FOX genes are correlated with poor clinical outcomes, tumor immunity, cancer-associated signaling pathways, and cancer hallmark biological processes. The COAD’s 32 FOX genes were deregulated (Table 1 and Figure 1). Based on earlier research, colorectal tumors frequently display different unregulated FOX genes. For example, FOXQ1, the top up-regulated gene with Log2FC 5.86, is up-regulated in colorectal cancer tissue samples and promotes cancer metastasis by regulating the PI3K/AKT signaling pathways.36 The elevated expression level of FOXD1 was found in human CRC tissues, and FOXD1 expression levels were correlated with tumor size and other clinical factors.37 FOXA2, another significantly upregulated gene, is overexpressed in colon cancer tissues, promotes EMT, inhibits apoptosis, and enhances the invasion ability of colon cancer cells.38 FOXP2, the top down-regulated FOX genes in COAD, promotes the invasion of hepatocellular carcinoma.39 Through controlling the EGFR/RAS/RAF/MEK/ERK axis, the second-ranked down-regulated gene, FOXD3, serves as a tumor suppressor to reduce the malignancy in colon tissue.40 The expression of FOXF2 in Hela cells and tumor tissues was lower than nearby tissues, and FOXF2 has been linked to preventing Hela cells from proliferating, migrating, and invading through controlling the Wnt biochemical signaling process.41 Consistent with these studies, our findings revealed that the deregulated FOX genes are crucially associated with colon carcinogenesis.
Since the PPI network is considered an anticancer therapeutic discovery,42 we built the PPI network of deregulated FOX genes. Interestingly, we found the five sub-networks (Figure 3) associated with FOX genes. Sub-network 1 (Figure 3A) is crucially linked to the various cancer-associated signaling processes (Figure 3A). Numerous pathways consistently regulate colorectal cancer and other malignancies. Farhan et al. reported that the FOXO signaling pathways are substantial therapeutic targets in cancer treatment strategy.43 Uddin et al. established that the various pathways in cancer, small cell lung cancer, p53, apoptosis, and notch signaling processes are enriched in the colon tumor microenvironment.44 FOXO subfamily members regulate the PI3K-AKT molecular pathway.7 The disruption of TGF-β signaling is crucially correlated with CRC tumorigenesis and progression.45 Altogether, the FOX gene-associated PPI network-mediated signaling cascades may be associated with colorectal carcinogenesis.
We identified that shorter COAD patient survival time is related to eight FOX genes (Figure 4). In numerous malignancies, the patient’s survival duration consistently correlates with the prognostic FOX genes we uncovered. For example, worse OS and DFS in colorectal cancer are linked to FOXC1 overexpression.46 Individuals with colorectal cancer have a poor prognosis when FOXD1 is up-regulated.37 Chen et al found that FOXD4 activity was increased in CRC and correlated with a short survival period.47 Reduced lung cancer survival rates are linked to up-regulated FOXH1 levels.48 FOXQ1, another prognostic gene, is poorly associated with prognosis in NSCLC.49 In patients with gastric cancer, overexpression of FOXS1 is related to a shorter survival period.50 Moreover, univariate, multivariable, and nomogram analyses showed that FOXD4, FOXH1, and FOXS1 are independent prognostic markers in COAD (Figure 5). These results indicate that those with colorectal cancer have a significantly reduced survival probability due to the dysfunctional activity of FOX genes.
The survival time of cancer patients is connected with immunogenicity, and immunological responses have a considerable effect on the clinical outcomes of patients.51 We evaluated the correlation of three independent prognostic FOX genes (FOXD4, FOXH1, and FOXS1) with tumor immunity in COAD (Figure 6). We found that the FOXH1 and FOXS1 genessubstantially regulate tumor immunity in COAD (Figure 6). First, the immune and stromal content are deregulated between the HEG and LEG of these FOX genes (Figure 6A). Second, these two prognostic FOX genes are significantly correlated with immune infiltrations (Figure 6B). Third, the FOXH1 and FOXS1 highly expressed group in COAD had considerably reduced ratios of pro-/anti-inflammatory cytokines (Figure 6C). Fourth, the FOXH1 and FOXS1 genes are correlated with immunosuppressive markers (Table 2). Tumor-associated macrophages (TAMs), leading immunosuppressive immune cells, stimulate CRC growth by modifying the extracellular matrix remodeling, tumor metabolism, angiogenesis, and the tumor microenvironment.52 In metastasis of colorectal carcinoma, M2 macrophages are associated with carcinogenesis and tumor development by enhancing the invasiveness of tumor cells.53 CAFs, another immunosuppressive member,54 improve the enrichment for TAMs and suppress NK activity in colorectal cancer.55 The immunosuppressive MDSCs are crucially related to the initiation and progression of CRC.56 The regulatory T cells (Tregs) contribute to the progression of human colorectal cancer.57 T cell exhaustion biomarkers, such as TIM-3/ HAVCR2, PD-1, CTLA4, and TIGIT, were overexpressed in CRC tumor tissues.58 Altogether, the prognostic FOX genes may be associated with the immunosuppressive colon tumor microenvironment by regulating the immune-inhibitory markers, stromal components, and immune cells.
We also evaluated the relationships between prognostic FOX genes and pathways linked to cancer and biological processes (Figure 7). Previous studies consistently found that the correlated cancer-associated pathways are enriched in colorectal cancer. For example, Uddin et al. found that cancer-related signaling processes, such as ECM-receptor interaction, focal adhesion, and Wnt signaling pathway, are significantly enriched in the colon tumor microenvironment.44 Hedgehog signaling is associated with CRC tissue formation, proliferation, and metastasis.59 In addition, the hallmark biological processes of cancer, including EMT, angiogenesis, and hypoxia, regulate the initiation, development, progression, and drug resistance of colorectal malignancies.60-62 These suggest that the deregulated prognostic FOX genes are associated with COAD carcinogenesis by regulating the cancer-associated pathways and hallmark biological processes.
Ultimately, we evaluated the genetic alteration and diagnostic efficacy of three independent prognostic factors (FOXD4, FOXH1, and FOXS1) in COAD (Figure 8). In addition, we investigated the expression variation of these prognostic markers in cancers using the Oncomine database and GSE166427 (Figure 8), and found consistent results which ultimately indicate the substantial roles of FOXD4, FOXH1, and FOXS1 incolon cancer. Furthermore, molecular docking studies revealed that FOXH1 potentially interacted with various drugs (Figure 9 and Figure 10). Li et al reported that FOXD4 was consistently found to have diagnostic and prognostic value in colonic cancer and to be linked to the nuclear matrix, Rap1 signaling pathway, RNA transportation, and VEGF signaling framework.63 The growth of gastric cancer is connected with aberrantly expressed FOXS1, which has the potential to serve as a biomarker for both diagnosis and prognosis.50 Overall, these findings indicate that these FOX genes may be crucial targets for the therapeutic implications of COAD.
Our study also has some drawbacks. First, our findings were obtained from a bioinformatics study and need experimental validation. Second, we analyzed COAD’s mRNA expression profiles, which are not equivalent to the protein expression levels. Hence, additional clinical and experimental verification will be required to convert these discoveries into practical uses for therapeutic targeting.
In conclusion, the dysfunctional FOX genes are substantially involved with poor clinical outcomes, immunogenicity, cancer-associated pathways, and oncogenic biological processes in COAD. This study may provide novel clues for targeting the FOX genes as potential therapeutics in COAD.
Supplementary Files
Supplementary file 1 contains the following tables: Table S1. List of the marker genes for identifying the ssGSEA scores immune signatures, cancer-associated pathways, and hallmark biological processes. Table S2. List of the biological processes significantly correlated to the suppressed FOX gene in COAD. Table S3. The list of nodes in the sub-network 1. Table S4. The list of significant KEGG pathways related to the sub-network.
(xlsx)
Competing Interests
There are no conflicts of interest.
Ethical Approval
This manuscript was not submitted simultaneously to more than one journal for publication and has not been published elsewhere. We presented the manuscript honestly, without fabrication, falsification, or inappropriate data manipulation.
References
- Jackson BC, Carpenter C, Nebert DW, Vasiliou V. Update of human and mouse forkhead box (FOX) gene families. Hum Genomics 2010; 4(5):345-52. doi: 10.1186/1479-7364-4-5-345 [Crossref] [ Google Scholar]
- Lam EW, Brosens JJ, Gomes AR, Koo CY. Forkhead box proteins: tuning forks for transcriptional harmony. Nat Rev Cancer 2013; 13(7):482-95. doi: 10.1038/nrc3539 [Crossref] [ Google Scholar]
- Bach DH, Long NP, Luu TT, Anh NH, Kwon SW, Lee SK. The dominant role of forkhead box proteins in cancer. Int J Mol Sci 2018; 19(10):3279. doi: 10.3390/ijms19103279 [Crossref] [ Google Scholar]
- Jonsson H, Peng SL. Forkhead transcription factors in immunology. Cell Mol Life Sci 2005; 62(4):397-409. doi: 10.1007/s00018-004-4365-8 [Crossref] [ Google Scholar]
- Lam EW, Gomes AR. Forkhead box transcription factors in cancer initiation, progression and chemotherapeutic drug response. Front Oncol 2014; 4:305. doi: 10.3389/fonc.2014.00305 [Crossref] [ Google Scholar]
- Katoh M, Igarashi M, Fukuda H, Nakagama H, Katoh M. Cancer genetics and genomics of human FOX family genes. Cancer Lett 2013; 328(2):198-206. doi: 10.1016/j.canlet.2012.09.017 [Crossref] [ Google Scholar]
- Laissue P. The forkhead-box family of transcription factors: key molecular players in colorectal cancer pathogenesis. Mol Cancer 2019; 18(1):5. doi: 10.1186/s12943-019-0938-x [Crossref] [ Google Scholar]
- Shan Y, Chang T, Shi S, Tang M, Bao L, Li L. Foxj2 overexpression is associated with poor prognosis, progression, and metastasis in nasopharyngeal carcinoma. Onco Targets Ther 2017; 10:3733-41. doi: 10.2147/ott.s134915 [Crossref] [ Google Scholar]
- Song BN, Chu IS. A gene expression signature of FOXM1 predicts the prognosis of hepatocellular carcinoma. Exp Mol Med 2018; 50(1):e418. doi: 10.1038/emm.2017.159 [Crossref] [ Google Scholar]
- Li J, Yan T, Wu X, Ke X, Li X, Zhu Y. Aberrant overexpression of transcription factor forkhead box D1 predicts poor prognosis and promotes cancer progression in HNSCC. BMC Cancer 2021; 21(1):1205. doi: 10.1186/s12885-021-08868-4 [Crossref] [ Google Scholar]
- Chu XY, Zhu ZM, Chen LB, Wang JH, Su QS, Yang JR. FOXM1 expression correlates with tumor invasion and a poor prognosis of colorectal cancer. Acta Histochem 2012; 114(8):755-62. doi: 10.1016/j.acthis.2012.01.002 [Crossref] [ Google Scholar]
- Deng Y, Wang F, Hughes T, Yu J. FOXOs in cancer immunity: knowns and unknowns. Semin Cancer Biol 2018; 50:53-64. doi: 10.1016/j.semcancer.2018.01.005 [Crossref] [ Google Scholar]
- Martin F, Ladoire S, Mignot G, Apetoh L, Ghiringhelli F. Human FOXP3 and cancer. Oncogene 2010; 29(29):4121-9. doi: 10.1038/onc.2010.174 [Crossref] [ Google Scholar]
- Sung H, Ferlay J, Siegel RL, Laversanne M, Soerjomataram I, Jemal A. Global cancer statistics 2020: GLOBOCAN estimates of incidence and mortality worldwide for 36 cancers in 185 countries. CA Cancer J Clin 2021; 71(3):209-49. doi: 10.3322/caac.21660 [Crossref] [ Google Scholar]
- Díez-Villanueva A, Jordà M, Carreras-Torres R, Alonso H, Cordero D, Guinó E. Identifying causal models between genetically regulated methylation patterns and gene expression in healthy colon tissue. Clin Epigenetics 2021; 13(1):162. doi: 10.1186/s13148-021-01148-9 [Crossref] [ Google Scholar]
- Ritchie ME, Phipson B, Wu D, Hu Y, Law CW, Shi W. limma powers differential expression analyses for RNA-sequencing and microarray studies. Nucleic Acids Res 2015; 43(7):e47. doi: 10.1093/nar/gkv007 [Crossref] [ Google Scholar]
- Subramanian A, Tamayo P, Mootha VK, Mukherjee S, Ebert BL, Gillette MA. Gene set enrichment analysis: a knowledge-based approach for interpreting genome-wide expression profiles. Proc Natl Acad Sci U S A 2005; 102(43):15545-50. doi: 10.1073/pnas.0506580102 [Crossref] [ Google Scholar]
- Jassal B, Matthews L, Viteri G, Gong C, Lorente P, Fabregat A. The reactome pathway knowledgebase. Nucleic Acids Res 2020; 48(D1):D498-D503. doi: 10.1093/nar/gkz1031 [Crossref] [ Google Scholar]
- Xia J, Gill EE, Hancock RE. NetworkAnalyst for statistical, visual and network-based meta-analysis of gene expression data. Nat Protoc 2015; 10(6):823-44. doi: 10.1038/nprot.2015.052 [Crossref] [ Google Scholar]
- Szklarczyk D, Gable AL, Lyon D, Junge A, Wyder S, Huerta-Cepas J. STRING v11: protein-protein association networks with increased coverage, supporting functional discovery in genome-wide experimental datasets. Nucleic Acids Res 2019; 47(D1):D607-D13. doi: 10.1093/nar/gky1131 [Crossref] [ Google Scholar]
- Shannon P, Markiel A, Ozier O, Baliga NS, Wang JT, Ramage D. Cytoscape: a software environment for integrated models of biomolecular interaction networks. Genome Res 2003; 13(11):2498-504. doi: 10.1101/gr.1239303 [Crossref] [ Google Scholar]
- Therneau T. A Package for survival analysis in R. 95. Available from: https://cran.r-project.org/web/packages/survival/.
- Yoshihara K, Shahmoradgoli M, Martínez E, Vegesna R, Kim H, Torres-Garcia W. Inferring tumour purity and stromal and immune cell admixture from expression data. Nat Commun 2013; 4:2612. doi: 10.1038/ncomms3612 [Crossref] [ Google Scholar]
- Hänzelmann S, Castelo R, Guinney J. GSVA: gene set variation analysis for microarray and RNA-seq data. BMC Bioinformatics 2013; 14:7. doi: 10.1186/1471-2105-14-7 [Crossref] [ Google Scholar]
- Tirosh I, Izar B, Prakadan SM, Wadsworth MH 2nd, Treacy D, Trombetta JJ. Dissecting the multicellular ecosystem of metastatic melanoma by single-cell RNA-seq. Science 2016; 352(6282):189-96. doi: 10.1126/science.aad0501 [Crossref] [ Google Scholar]
- Aran D, Hu Z, Butte AJ. xCell: digitally portraying the tissue cellular heterogeneity landscape. Genome Biol 2017; 18(1):220. doi: 10.1186/s13059-017-1349-1 [Crossref] [ Google Scholar]
- Davoli T, Uno H, Wooten EC, Elledge SJ. Tumor aneuploidy correlates with markers of immune evasion and with reduced response to immunotherapy. Science 2017; 355(6322):eaaf8399. doi: 10.1126/science.aaf8399 [Crossref] [ Google Scholar]
- Liu Z, Li M, Jiang Z, Wang X. A comprehensive immunologic portrait of triple-negative breast cancer. Transl Oncol 2018; 11(2):311-29. doi: 10.1016/j.tranon.2018.01.011 [Crossref] [ Google Scholar]
- Chen B, Li L, Li M, Wang X. HIF1A expression correlates with increased tumor immune and stromal signatures and aggressive phenotypes in human cancers. Cell Oncol (Dordr) 2020; 43(5):877-88. doi: 10.1007/s13402-020-00534-4 [Crossref] [ Google Scholar]
- Robin X, Turck N, Hainard A, Tiberti N, Lisacek F, Sanchez JC. pROC: an open-source package for R and S + to analyze and compare ROC curves. BMC Bioinformatics 2011; 12:77. doi: 10.1186/1471-2105-12-77 [Crossref] [ Google Scholar]
- Yang Q, Wang R, Wei B, Peng C, Wang L, Hu G. Candidate biomarkers and molecular mechanism investigation for glioblastoma multiforme utilizing WGCNA. Biomed Res Int 2018; 2018:4246703. doi: 10.1155/2018/4246703 [Crossref] [ Google Scholar]
- Ohtani H. Focus on TILs: prognostic significance of tumor infiltrating lymphocytes in human colorectal cancer. Cancer Immun 2007; 7:4. [ Google Scholar]
- Anne M, Sammartino D, Barginear MF, Budman D. Profile of panobinostat and its potential for treatment in solid tumors: an update. Onco Targets Ther 2013; 6:1613-24. doi: 10.2147/ott.s30773 [Crossref] [ Google Scholar]
- Beck HC, Petersen J, Nielsen SJ, Morsczeck C, Jensen PB, Sehested M. Proteomic profiling of human colon cancer cells treated with the histone deacetylase inhibitor belinostat. Electrophoresis 2010; 31(16):2714-21. doi: 10.1002/elps.201000033 [Crossref] [ Google Scholar]
- Hicks KC, Chariou PL, Ozawa Y, Minnar CM, Knudson KM, Meyer TJ. Tumour-targeted interleukin-12 and entinostat combination therapy improves cancer survival by reprogramming the tumour immune cell landscape. Nat Commun 2021; 12(1):5151. doi: 10.1038/s41467-021-25393-x [Crossref] [ Google Scholar]
- Liu JY, Wu XY, Wu GN, Liu FK, Yao XQ. FOXQ1 promotes cancer metastasis by PI3K/AKT signaling regulation in colorectal carcinoma. Am J Transl Res 2017; 9(5):2207-18. [ Google Scholar]
- Pan F, Li M, Chen W. FOXD1 predicts prognosis of colorectal cancer patients and promotes colorectal cancer progression via the ERK 1/2 pathway. Am J Transl Res 2018; 10(5):1522-30. [ Google Scholar]
- Wang B, Liu G, Ding L, Zhao J, Lu Y. FOXA2 promotes the proliferation, migration and invasion, and epithelial mesenchymal transition in colon cancer. Exp Ther Med 2018; 16(1):133-40. doi: 10.3892/etm.2018.6157 [Crossref] [ Google Scholar]
- Yan X, Zhou H, Zhang T, Xu P, Zhang S, Huang W. Downregulation of FOXP2 promoter human hepatocellular carcinoma cell invasion. Tumour Biol 2015; 36(12):9611-9. doi: 10.1007/s13277-015-3701-y [Crossref] [ Google Scholar]
- Li K, Guo Q, Yang J, Chen H, Hu K, Zhao J. FOXD3 is a tumor suppressor of colon cancer by inhibiting EGFR-Ras-Raf-MEK-ERK signal pathway. Oncotarget 2017; 8(3):5048-56. doi: 10.18632/oncotarget.13790 [Crossref] [ Google Scholar]
- Zhang J, Zhang C, Sang L, Huang L, Du J, Zhao X. FOXF2 inhibits proliferation, migration, and invasion of Hela cells by regulating Wnt signaling pathway. Biosci Rep 2018; 38(5):BSR20180747. doi: 10.1042/bsr20180747 [Crossref] [ Google Scholar]
- Ivanov AA, Khuri FR, Fu H. Targeting protein-protein interactions as an anticancer strategy. Trends Pharmacol Sci 2013; 34(7):393-400. doi: 10.1016/j.tips.2013.04.007 [Crossref] [ Google Scholar]
- Farhan M, Wang H, Gaur U, Little PJ, Xu J, Zheng W. FOXO signaling pathways as therapeutic targets in cancer. Int J Biol Sci 2017; 13(7):815-27. doi: 10.7150/ijbs.20052 [Crossref] [ Google Scholar]
- Uddin MN, Li M, Wang X. Identification of transcriptional signatures of colon tumor stroma by a meta-analysis. J Oncol 2019; 2019:8752862. doi: 10.1155/2019/8752862 [Crossref] [ Google Scholar]
- Itatani Y, Kawada K, Sakai Y. Transforming growth factor-β signaling pathway in colorectal cancer and its tumor microenvironment. Int J Mol Sci 2019; 20(23):5822. doi: 10.3390/ijms20235822 [Crossref] [ Google Scholar]
- Li Q, Wei P, Wu J, Zhang M, Li G, Li Y. The FOXC1/FBP1 signaling axis promotes colorectal cancer proliferation by enhancing the Warburg effect. Oncogene 2019; 38(4):483-96. doi: 10.1038/s41388-018-0469-8 [Crossref] [ Google Scholar]
- Chen C, Aihemaiti M, Zhang X, Qu H, Jiao J, Sun Q. FOXD4 induces tumor progression in colorectal cancer by regulation of the SNAI3/CDH1 axis. Cancer Biol Ther 2018; 19(11):1065-71. doi: 10.1080/15384047.2018.1480291 [Crossref] [ Google Scholar]
- Zhang J, Zhang X, Yang S, Bao Y, Xu D, Liu L. FOXH1 promotes lung cancer progression by activating the Wnt/β-catenin signaling pathway. Cancer Cell Int 2021; 21(1):293. doi: 10.1186/s12935-021-01995-9 [Crossref] [ Google Scholar]
- Feng J, Zhang X, Zhu H, Wang X, Ni S, Huang J. FoxQ1 overexpression influences poor prognosis in non-small cell lung cancer, associates with the phenomenon of EMT. PLoS One 2012; 7(6):e39937. doi: 10.1371/journal.pone.0039937 [Crossref] [ Google Scholar]
- Wang S, Ran L, Zhang W, Leng X, Wang K, Liu G. FOXS1 is regulated by GLI1 and miR-125a-5p and promotes cell proliferation and EMT in gastric cancer. Sci Rep 2019; 9(1):5281. doi: 10.1038/s41598-019-41717-w [Crossref] [ Google Scholar]
- Liu Y. Survival correlation of immune response in human cancers. Oncotarget 2019; 10(64):6885-97. doi: 10.18632/oncotarget.27360 [Crossref] [ Google Scholar]
- Zhong X, Chen B, Yang Z. The role of tumor-associated macrophages in colorectal carcinoma progression. Cell Physiol Biochem 2018; 45(1):356-65. doi: 10.1159/000486816 [Crossref] [ Google Scholar]
- Wang Y, Wang J, Yang C, Wang Y, Liu J, Shi Z. A study of the correlation between M2 macrophages and lymph node metastasis of colorectal carcinoma. World J Surg Oncol 2021; 19(1):91. doi: 10.1186/s12957-021-02195-5 [Crossref] [ Google Scholar]
- Uddin MN, Wang X. The landscape of long non-coding RNAs in tumor stroma. Life Sci 2021; 264:118725. doi: 10.1016/j.lfs.2020.118725 [Crossref] [ Google Scholar]
- Zhang R, Qi F, Zhao F, Li G, Shao S, Zhang X. Cancer-associated fibroblasts enhance tumor-associated macrophages enrichment and suppress NK cells function in colorectal cancer. Cell Death Dis 2019; 10(4):273. doi: 10.1038/s41419-019-1435-2 [Crossref] [ Google Scholar]
- Sieminska I, Baran J. Myeloid-derived suppressor cells in colorectal cancer. Front Immunol 2020; 11:1526. doi: 10.3389/fimmu.2020.01526 [Crossref] [ Google Scholar]
- Betts G, Jones E, Junaid S, El-Shanawany T, Scurr M, Mizen P. Suppression of tumour-specific CD4⁺ T cells by regulatory T cells is associated with progression of human colorectal cancer. Gut 2012; 61(8):1163-71. doi: 10.1136/gutjnl-2011-300970 [Crossref] [ Google Scholar]
- Saleh R, Taha RZ, Toor SM, Sasidharan Nair V, Murshed K, Khawar M. Expression of immune checkpoints and T cell exhaustion markers in early and advanced stages of colorectal cancer. Cancer Immunol Immunother 2020; 69(10):1989-99. doi: 10.1007/s00262-020-02593-w [Crossref] [ Google Scholar]
- Wu C, Zhu X, Liu W, Ruan T, Tao K. Hedgehog signaling pathway in colorectal cancer: function, mechanism, and therapy. Onco Targets Ther 2017; 10:3249-59. doi: 10.2147/ott.s139639 [Crossref] [ Google Scholar]
- Bates RC, Mercurio AM. The epithelial-mesenchymal transition (EMT) and colorectal cancer progression. Cancer Biol Ther 2005; 4(4):365-70. doi: 10.4161/cbt.4.4.1655 [Crossref] [ Google Scholar]
- Mousa L, Salem ME, Mikhail S. Biomarkers of angiogenesis in colorectal cancer. Biomark Cancer 2015; 7(Suppl 1):13-9. doi: 10.4137/bic.s25250 [Crossref] [ Google Scholar]
- Xu K, Zhan Y, Yuan Z, Qiu Y, Wang H, Fan G. Hypoxia induces drug resistance in colorectal cancer through the HIF-1α/miR-338-5p/IL-6 feedback loop. Mol Ther 2019; 27(10):1810-24. doi: 10.1016/j.ymthe.2019.05.017 [Crossref] [ Google Scholar]
- Li QX, Li NQ, Liao JY. Diagnostic and prognostic values of forkhead box D4 gene in colonic adenocarcinoma. Int J Clin Exp Pathol 2020; 13(10):2615-27. [ Google Scholar]