Arch Iran Med. 25(6):383-393.
doi: 10.34172/aim.2022.62
Original Article
Severity of Disease and COVID-19 Complications During Hospital Stay: A Prospective Cohort Study
Ramin Sami 1  , Forogh Soltaninejad 1 , Azin Shayganfar 2 , Sam Mirfendereski 2 , Marjan Mansourian 3 , Nilufar Khademi 4 , Mehrnegar Dehghan 4 , Zahra Khorrami 5, Soheila Jalali 6, Zeinab Mokhtari 7, *
Author information:
1Department of Internal Medicine, School of Medicine, Isfahan University of Medical Sciences, Isfahan, Iran
2Department of Radiology, School of Medicine, Isfahan University of Medical Sciences, Isfahan, Iran
3Biostatistics, Pediatric Cardiovascular Research Center, Cardiovascular Research Institute, Isfahan University of Medical Sciences, Isfahan, Iran
4School of Medicine, Isfahan University of Medical Sciences, Isfahan, Iran
5Ophthalmic Epidemiology Research Center, Research Institute for Ophthalmology and Vision Science, Shahid Beheshti University of Medical Sciences, Tehran, Iran
6Department of Epidemiology and Biostatistics, School of Health, Isfahan University of Medical Sciences, Isfahan, Iran
7Food Security Research Center, Isfahan University of Medical Sciences, Isfahan, Iran
Abstract
Background:
COVID-19, with its high transmission and mortality rates and unknown outcomes, has become a major concern in the world. Among people with COVID-19, severe cases can quickly progress to serious complications, and even death. So, the present study aimed to examine the relationship between the severity of the disease and the outcome in patients afflicted by COVID-19 during hospitalization.
Methods:
A total of 653 patients with COVID-19 aged 18 years or older were included from Khorshid hospital in Isfahan, Iran and followed for a mean of 22.72 days (median 23.50; range 1–47). Severe COVID-19 was defined by respiration rate≥30 times/min, oxygen saturation level≤88% in the resting position, and pulse rate≥130/min. The primary outcome was mortality. The secondary outcomes included need for mechanical ventilation and intensive care unit (ICU) admission.
Results:
During 4233 person-days of follow-up, 49 (7.5%) deaths, 27 (4.1%) invasive ventilation and 89 (13.6%) ICU admissions in hospital were reported. After adjustment for potential confounders, severity of the disease was positively associated with risk of mortality, invasive ventilation and ICU admissions (hazard ratio [HR]: 5.99; 95% CI: 2.85, 12.59; P<0.001, HR: 7.09; 95% CI: 3.24, 15.52; P<0.001 and HR: 4.88; 95% CI: 2.98, 7.98; P<0.001, respectively). In addition, greater age (HR=1.04; 95% CI=1.02-1.07; P=0.002), chronic kidney disease (HR=3.05; 95% CI=1.35, 6.90; P=0.008), blood urea nitrogen (BUN) (HR=1.04; 95% CI=1.03–1.05; P<0.001) and creatinine (HR=1.44; 95% CI=1.26-1.65; P<0.001) were probably significant risk factors for mortality in severe COVID-19 patients.
Conclusion:
More intensive therapy and special monitoring should be implemented for patients with older age, hypertension and kidney disease who are infected with COVID-19 to prevent rapid worsening.
Keywords: COVID-19, ICU admission, Mortality, SARS-CoV-2, Severity
Copyright and License Information
© 2022 The Author(s).
This is an open-access article distributed under the terms of the Creative Commons Attribution License (
https://creativecommons.org/licenses/by/4.0), which permits unrestricted use, distribution, and reproduction in any medium, provided the original work is properly cited.
Cite this article as: Sami R, Soltaninejad F, Shayganfar A, Mirfendereski S, Mansourian M, Khademi N, et al. Severity of disease and covid-19 complications during hospital stay: a prospective cohort study. Arch Iran Med. 2022;25(6):383-393. doi: 10.34172/ aim.2022.62
Introduction
Severe acute respiratory syndrome coronavirus 2 (SARS-CoV-2), with its high transmission and mortality rates and unknown outcomes, has become a major concern in the world.1 About the end June 2022, according to the World Health Organization (WHO), more than 537 million people were infected with the virus worldwide, with nearly 6 319 395 deaths in the world.2 Although most people with COVID-19 have a mild form of the disease and a good prognosis, severe cases can quickly progress to pneumonia, acute distress syndrome, multiple organ dysfunction, and even death.3,4 Besides, complications such as heart disease,5 arterial thromboembolism,6,7 encephalopathy,8 and other neurological manifestations9 have been observed in these patients. Currently, no approved specific and effective treatment is available for COVID-19, and patients receive symptomatic and supportive treatment.10
The outcome and presentations of this infectious disease depend on different factors. The findings of a systematic review revealed that underlying diseases, including hypertension, cardiovascular disease, and diabetes, as well as the presence of acute inflammation and abnormal kidney and liver function tests, are associated with increased risk of mortality with COVID-19.11 Additionally, male gender, higher age, and morbid obesity may contribute to a poorer clinical outcome.12-14 In addition to individual characteristics, the disease complications may be affected by the effects of COVID-19 on healthcare systems.15,16
Due to the recent emergence of the novel coronavirus, our understanding of the complications and end-points of SARS-CoV-2, especially in the Middle East, is still limited. Moreover, the existing evidence has shortcomings due to the small sample size of the studies and the lack of follow-up of the patients. Furthermore, the complications of SARS-CoV-2 impose a huge burden on the healthcare system, especially in developing countries that face critical shortages in terms of healthcare staff and facilities. Therefore, understanding the consequences associated with this viral infection, especially in its severe form, would help in finding effective treatments for this disease, preventing its acute complications, reducing its mortality, and effectively prioritizing healthcare resources. Hence, the present study aimed to examine the relationship between the severity of the disease and the outcome in patients afflicted by COVID-19during hospitalization.
Methods and Materials
Study Population
This was a prospective, single-center cohort study. The Khorshid COVID Cohort (KCC) study was initiated in February 2020, at Khorshid hospital in Isfahan, Iran. Khorshid Hospital is the referral center for adults suffering from COVID-19 in Isfahan. The design of the KCC has been reported previously.17 The follow-up flow chart is presented in Supplementary file 1 (Figure S1). All adult patients (≥ 18 years old) who were diagnosed with COVID-19 based on positive results of reverse transcription polymerase chain reaction (RT-PCR) of pharyngeal swab samples or typical lesions of the disease on chest CT scans18 were recruited. The exclusion criteria were patients refusing to participate in the study, pregnant or breastfeeding women, and prison inmates. Eligible patients were divided into two groups according to the severity of the disease. Based on the consensus of clinicians and previous evidence,19 the diagnosis of severe disease would be determined if all the criteria including respiration rate (RR) ≥ 30 times/min, oxygen saturation level ≤ 88% in the resting position, and pulse rate ≥ 130/min were met.
Clinical and Paraclinical Assessment
At the baseline, information on demographics, medical history, and underlying chronic diseases was obtained from the medical records of the patients using an organized questionnaire. Body temperature, RR, oxygen saturation, heart rate, systolic blood pressure (SBP), diastolic blood pressure (DBP), weight, and height of the patients were evaluated on admission to the emergency ward by trained nurses. Routine blood examinations including complete blood count with differential, hemoglobin (Hb), liver functional tests (alanine aminotransferase [ALT] and aspartate aminotransferase [AST]), lactate dehydrogenase (LDH), inflammatory factors (ferritin, C-reactive protein [CRP], erythrocyte sedimentation rate [ESR]), blood urea nitrogen (BUN), creatinine, and arterial blood gases (PH, HCO3, PCO2) were measured at the baseline for each person. A total of 436 patients underwent pulmonary CT scanning by a 64-slice Philips scanner according to the protocol of low dose and non-contrast chest CT. Images were analyzed by two experienced radiologists. Diagnosis of suspected patients was made based on the Radiological Society of North America (RSNA) guidelines.20,21 For quantifying the results of lung abnormalities on CT scan, a thin-section CT score was calculated based on the extent of involved areas.22
Follow-up and Improvement Ascertainment
All participants were followed until discharge from the hospital or death. During a mean follow-up of 22.72 days, (median 23.50; range 1–47), all of the participants completed follow-up. The primary outcome was mortality after hospital admission. The secondary outcomes included need for mechanical ventilation and admission to the intensive care unit (ICU). Discharge criteria were defined as respiratory rate < 20, pulse rate < 100, oxygen saturation > 92% in the resting state, normal body temperature (< 38℃) for more than two days without any antipyretic treatments, and the ability to normally swallow solid oral medication. However, some patients stayed in the hospital up to 14 days after the onset of the symptoms because appropriate care conditions and suitable provisions for quarantine at home could not be ensured.23 Any reported death was verified by a physician’s visit. Hospitalization duration was determined in days (from the date of hospital admission to the date of discharge).
Statistical Analysis
According to the severity of the disease, participants were divided into two groups of severe and non-severe disease. The participants’ characteristics were compared between the two groups using the independent t test for continuous variables and the chi-square test for categorical ones. Multivariable logistic regression analysis was used to assess the relationship between baseline characteristics and the severity of COVID-19. Furthermore, in order to test for the association between the severity of the disease and the risk of mortality, mechanical ventilation, and admission to ICU, Cox proportional hazards regression models were constructed to estimate hazard ratios (HRs) and 95% confidence intervals (CIs). In the multivariable model, the HRs were adjusted for potential confounders, including age in years (continuous), gender (male, female), education (illiterate, high-school graduate, college graduate), systolic blood pressure, history of hypertension (yes, no), CT score (continuous) and other continuous covariates (white blood cell count, neutrophil and lymphocyte counts, AST, ferritin, CRP, ESR, BUN, and creatinine). An P value less than 0.2 in the crude model for these variables was considered as a criterion for adjusting potential confounding factors in the adjusted model. Follow-up time was considered for each patient from the date they were recruited into the study until the date of death, failure to follow-up, discharge from the hospital, or the end of follow-up (April 30, 2020), whichever happened first. All statistical analyses were performed using Stata version 14 (Stata Corp LLC; College Station, TX, USA). The statistical significance level in all tests was P ≤ 0.05, with two-tailed statistical analysis.
Results
A total of 653 patients with COVID-19 were included in the study. Of these, 604 (92.5%) were discharged, 49 (7.5%) died in hospital, 27 (4.1%) needed invasive ventilation and 89 (13.6%) were admitted to the ICU. Almost a third of the patients (35.1%) were identified as severe cases and 64.9% were non-severe cases on admission. The incidence rates of mortality, required intubation and ICU admission were 1.68, 1.14 and 12.83 per 1000 person-days, respectively. The mean age (SD) of participants at the baseline was 57.26 (15.48) years. Overall, 61.1% were men. The baseline characteristics of the participants are shown in Table 1. Severe patients were older and more likely to have lower education and higher percent of CT score for severity in comparison to those with non-severe disease. Furthermore, hypertension was the most common co-morbidity (34.9%) in all patients and significantly more frequent in the severe cases compared with non-severe patients (100 (43.7%) vs 128 (30.2%), P<0.001). The mean systolic blood pressure, white blood cell count, neutrophil and lymphocyte counts, liver tests (AST and LDH), inflammatory markers (ferritin, CRP and ESR), kidney tests (BUN and creatinine), and hospitalization days were significantly higher in severe patients with COVID-19 than non-severe cases. Furthermore, a significant decrease was observed in hemoglobin levels in severe subjects. Moreover, the prevalence rates of death, invasive ventilation, and ICU admission were significantly higher in severe cases compared to non-severe patients (Table 1).
Table 1.
Characteristics of Hospitalized Patients with COVID-19 in the Khorshid Cohort Studya
|
Characteristic
|
All Patients
|
Severe
|
Non-severe
|
P
Value
b
|
| N (%) |
653 (100) |
229 (35.1) |
424 (64.9) |
|
| Gender |
|
|
|
0.556 |
| Female, n (%) |
254 (38.9) |
93 (36.6) |
161 (63.4) |
|
| Male, n (%) |
399 (61.1) |
136 (34.1) |
263 (65.9) |
|
| Age (year), Mean ± SD |
57.26 ± 15.48 |
63.75 ± 14.34 |
53.77 ± 14.95 |
< 0.001 |
| BMI (kg/m2), Mean ± SD |
27.42 ± 3.26 |
27.23 ± 3.08 |
27.52 ± 3.35 |
0.274 |
| Normal weight, n (%) c |
90 (13.8) |
36(40.0) |
54 (60.0) |
0.342 |
| Overweight and Obese n (%) |
556 (85.1) |
192(34.5) |
364 (65.5) |
| Smoker (Current), n (%) |
72 (11.0) |
22(30.5) |
50 (69.5) |
0.146 |
| Education, n (%) |
|
|
|
0.004 |
| Illiterate |
110 (16.8) |
48 (43.6) |
62 (56.4) |
|
| High-school graduate |
59 (9.0) |
16 (27.1) |
43 (72.9) |
| College graduate |
54 (8.3) |
13 (24.1) |
41 (75.9) |
| Temperature on admission (categorized, > 38℃), n (%) |
91 (13.9) |
27 (29.7) |
64 (70.3) |
0.287 |
| Systolic blood pressure (mm Hg), Mean ± SD |
132.90 ± 19.63) |
134.69 ± 20.48) |
131.94 ± 19.12) |
0.031 |
| Diastolic blood pressure (mm Hg), Mean ± SD |
81.86 ± 28.27) |
82.39 ± 44.83) |
81.58 ± 12.07) |
0.717 |
| CT score for severity, Mean ± SD |
10.12 ± 5.02 |
12.33 ± 5.55 |
9.17 ± 4.45 |
< 0.001 |
| Co-morbidities (Yes) |
|
|
|
|
| History of diabetes, n (%) |
181 (27.7) |
69 (38.1) |
112 (61.9) |
0.315 |
| History of hypertension, n (%) |
228 (34.9) |
100 (43.9) |
128 (56.1) |
< 0.001 |
| Cardiovascular disease, n (%) |
131 (20.1) |
53 (40.5) |
78 (59.5) |
0.154 |
| Respiratory disease, n (%) |
71 (10.9) |
31 (43.7) |
40 (56.3) |
0.115 |
| Chronic kidney disease, n (%) |
36 (5.5) |
17 (47.2) |
19 (52.8) |
0.149 |
| Biochemistry parameters |
|
|
|
|
| White blood cell count (× 109/L), Mean ± SD |
6074.47 ± 3059.31 |
6895.13 ± 3818.51 |
5630.43 ± 2449.42 |
< 0.001 |
| Neutrophil count (%), Mean ± SD |
73.19 ± 11.49 |
78.07 ± 9.87 |
70.53 ± 11.44 |
< 0.001 |
| Lymphocyte count (%), Mean ± SD |
20.87 ± 9.89 |
16.73 ± 8.75 |
23.12 ± 9.75 |
< 0.001 |
| Platelet count (× 109/L), Mean ± SD |
188.37 ± 71.52 |
188.91 ± 77.13 |
188.07 ± 68.38 |
0.888 |
| Hemoglobin (g/dL), Mean ± SD |
13.21 ± 1.85 |
12.93 ± 2.03 |
13.37 ± 1.72 |
0.006 |
| Liver tests |
|
|
|
|
| ALT (U/L), Mean ± SD |
33.32 ± 45.57 |
32.87 ± 37.33 |
33.57 ± 49.71 |
0.857 |
| AST (U/L), Mean ± SD |
46.46 ± 47.33 |
53.95 ± 69.98 |
42.21 ± 26.31 |
0.017 |
| LDH (U/L), Mean ± SD |
695.85 ± 898.71 |
929.30 ± 711.87 |
539.40 ± 225.40 |
0.028 |
| Inflammatory factors |
|
|
|
|
| Ferritin (ng/mL), Mean ± SD |
548.65 ± 274.52 |
607.14(297.77 |
494.67 ± 241.05 |
0.021 |
| CRP (mg/L), Mean ± SD |
30.56 ± 22.31 |
36.59 ± 23.02 |
26.81 ± 21.04 |
< 0.001 |
| ESR (ml/h), Mean ± SD |
47.54 ± 27.51 |
53.10 ± 29.09 |
42.94 ± 25.94 |
< 0.001 |
| Kidney tests |
|
|
|
|
| BUN (mg/dL), Mean ± SD |
19.96 ± 14.04 |
23.33 ± 16.74 |
18.11 ± 11.93 |
< 0.001 |
| Cr (mg/dL), Mean ± SD |
1.23 ± 1.09 |
1.36 ± 1.25 |
1.16 ± 0.99 |
0.040 |
| Arterial blood gas |
|
|
|
|
| PH, Mean ± SD |
7.36 ± 0.06 |
7.36 ± 0.06 |
7.36 ± 0.06 |
0.947 |
| HCO3 (mm Hg), Mean ± SD |
23.65 ± 3.67 |
23.59 ± 3.75 |
23.69 ± 3.62 |
0.758 |
| PCO2 (mm Hg), Mean ± SD |
44.37 ± 9.77 |
44.18 ± 10.26 |
44.47 ± 9.50 |
0.721 |
| Length hospital day, Mean ± SD |
6.48 ± 5.64 |
8.60 ± 6.83 |
5.34 ± 4.50 |
< 0.001 |
| SARS-CoV-2 nucleic acid test |
|
|
|
|
| Positive, n (%) |
450 (68.9) |
178 (39.6) |
272 (60.4) |
|
| Negative, n (%) |
140 (21.4) |
36 (25.7) |
104 (74.3) |
|
| Without test-Positive chest CT scans, n (%) |
63 (9.7) |
15 (23.8) |
48 (76.2) |
|
| Outcomes |
|
|
|
|
| Death, n (%) |
49 (7.5) |
40 (81.6) |
9 (18.4) |
< 0.001 |
| Invasive ventilation, n (%) |
27 (4.1) |
25 (92.6) |
2 (7.4) |
< 0.001 |
| ICU admission, n (%) |
89 (13.6) |
65 (73.0) |
24 (27.0) |
< 0.001 |
a Values are expressed as means ± SD for continuous variables and percentages for categorical variables.
b Independent t test for quantitative variables and χ2 test for qualitative variables.
c Normal weight: BMI lower than 24.9, Overweight and obese: BMI more than 25.
As shown in Table 2, ground glass opacity (GGO) with or without consolidation appeared in nearly half of all patients. The incidence of GGO in the severe group tended to be higher than non-severe participants (50.4% vs 41.1%, P= 0.076). However, the other morphology of lesion patterns (consolidation and crazy paving pattern) were similar in severe and non-severe groups. Pleural effusion was found in only 7.3% of participants which was significantly different in severe patients in comparison to non-severe patients (12.0% vs 5.2%, P= 0.01). Moreover, distribution of the lesions was noticed in lower lobes at 49.9% and in upper lobes at 7.9%, and involvement of lower lobes was significantly more in non-severe than severe subjects (53.0% vs 42.7%, P= 0.023). Additionally, a multifocal pattern was seen in 91.1% of all patients, which was higher in non-severe than severe cases (91.6 % vs 89.7%, P= 0.001).
Table 2.
Baseline Radiographic Findings of Patients with COVID-19
|
CT Findings
|
All Patients
|
Severe (n=133)
|
Non-severe (n=309)
|
P
Value
a
|
| GGO |
|
|
|
0.076 |
| Negative |
248 (56.1%) |
66 (49.6%) |
182 (58.9%) |
| Positive |
194 (43.9%) |
67 (50.4%) |
127 (41.1%) |
| GGO consolidation |
|
|
|
0.209 |
| Negative |
240 (54.9%) |
79 (59.8%) |
161 (52.8%) |
| Positive |
197 (45.1%) |
53 (40.2%) |
144 (47.2%) |
| Consolidation |
|
|
|
0.201 |
| Negative |
408 (93.6%) |
127 (96.2%) |
281 (92.4%) |
| Positive |
28 (6.4%) |
5 (3.8%) |
23 (7.6%) |
| CN |
|
|
|
0.093 |
| Negative |
413 (95.6%) |
128 (97.7%) |
285 (94.7%) |
| Positive |
19 (2.9%) |
3 (2.3%) |
16 (5.3%) |
| BronWT |
|
|
|
0.315 |
| Negative |
402 (93.1%) |
121 (92.4%) |
281 (93.4%) |
| Positive |
30 (6.9%) |
10 (7.6%) |
20 (6.6%) |
| Ret |
|
|
|
0.361 |
| Negative |
271 (62.3%) |
77 (58.3%) |
194 (64.0%) |
| Positive |
164 (37.7%) |
55 (41.7%) |
109 (35.0%) |
| LAP |
|
|
|
0.085 |
| Negative |
432 (99.8%) |
130 (99.2%) |
302 (100.0%) |
| Positive |
1 (0.2%) |
1 (0.8%) |
0 (0.0%) |
| Vas Enlarge |
|
|
|
0.145 |
| Negative |
410 (94.5%) |
127 (96.2%) |
283 (93.7%) |
| Positive |
24 (5.5%) |
5 (3.8%) |
19 (6.3%) |
| Pleural Effusion |
|
|
|
0.010 |
| Negative |
407 (92.7%) |
117 (88.0%) |
290 (94.8%) |
| Positive |
32 (7.3%) |
16 (12.0%) |
16 (5.2%) |
| Distribution |
|
|
|
0.023 |
| None |
183 (42.2%) |
66 (50.4%) |
117 (38.7%) |
| Upper |
34 (7.9%) |
9 (6.9%) |
25 (8.3%) |
| Lower |
216 (49.9%) |
56 (42.7%) |
160 (53.0%) |
| Transverse |
|
|
|
0.112 |
| None |
107 (27.2%) |
43 (32.2%) |
64 (23.5%) |
| Peripheral |
272 (69.0%) |
73 (59.8%) |
199 (73.0%) |
| Central |
15 (3.8%) |
6 (4.9%) |
9 (3.3%) |
| Region |
|
|
|
0.138 |
| Unilateral |
34 (8.3%) |
5 (4.1%) |
29 (10.0%) |
| Bilateral |
377 (91.7%) |
117 (95.9%) |
260 (90.0%) |
| Scattered |
|
|
|
0.001 |
| Focal |
19 (4.5%) |
1 (0.8%) |
18 (6.0%) |
| Multifocal |
386 (91.0%) |
113 (89.7%) |
273 (91.6%) |
| Diffuse |
19 (4.5%) |
12 (9.5%) |
7 (2.3%) |
a Based on χ2 test, Fisher exact test, or Mann-Whitney U test.
GGO, ground glass opacity; CN, centric nodular lesions; BronWT, bronchial wall thickening; Ret, reticular pattern; LAP, lymphadenopathy; Vas Enlarge, vascular enlargement.
After multivariable adjustment, the chance of severe disease was augmented with increasing age (OR:1.04; 95% CI: 1.01, 1.08; P= 0.021), CT score (OR = 1.13; 95% CI = 1.03,1.24; P= 0.011), and history of hypertension (OR = 2.90; 95% CI = 1.15,7.34; P= 0.024). In addition, higher serum ferritin concentrations were associated with severe disease (OR = 1.01; 95% CI = 1.00,1.02; P= 0.010) (Table 3).
Table 3.
Association between Different Potential Risk Factors and Severity of COVID-19 on Admission
|
Variable
|
Unadjusted Model
|
Adjusted Model
b
|
|
|
OR (CI 95%)
|
P
Value
a
|
OR (CI 95%)
|
P
Value
a
|
| Gender (Men), n (%) |
1.12 (0.80,1.55) |
0.509 |
|
|
| Age (year) |
1.05 (1.04,1.06) |
< 0.001 |
1.04 (1.01,1.08) |
0.021 |
| Normal weight, n (%) c |
Ref. |
0.315 |
|
|
| Overweight and Obese n (%) |
0.79 (0.50,1.25) |
|
|
|
| Smoker (Current), n (%) |
0.97 (0.56,1.65) |
0.899 |
|
|
| Education, n (%) |
|
|
|
|
| Illiterate |
Ref. |
|
Ref. |
|
| High-school graduate |
0.42 (0.22, 0.81) |
0.010 |
0.50 (0.15, 1.64) |
0.250 |
| College graduate |
0.36 (0.18, 0.72) |
0.004 |
0.68 (0.20, 2.23) |
0.519 |
| Temperature on admission (categorized, > 38℃), n (%) |
0.75 (0.46, 1.22) |
0.246 |
|
|
| Systolic blood pressure (mm Hg) |
1.01 (0.99, 1.02) |
0.089 |
0.97 (0.95, 0.99) |
0.023 |
| Diastolic blood pressure (mm Hg) |
1.0 (0.99, 1.01) |
0.730 |
|
|
| CT score for severity n (%) |
1.14 (1.09, 1.195) |
< 0.001 |
1.13 (1.03, 1.24) |
0.011 |
| Co-morbidities (yes) |
|
|
|
|
| History of diabetes, n (%) |
1.20 (0.84, 1.71) |
0.312 |
|
|
| History of hypertension, n (%) |
1.79 (1.28, 2.50) |
0.001 |
2.90 (1.15, 7.34) |
0.024 |
| Cardiovascular disease, n (%) |
1.33 (0.90, 1.97) |
0.153 |
0.86 (0.29, 2.56) |
0.780 |
| Respiratory disease, n (%) |
1.50 (0.91, 2.48) |
0.110 |
0.71 (0.13, 3.93) |
0.697 |
| Chronic kidney disease, n (%) |
1.71 (0.87, 3.36) |
0.120 |
1.08 (0.12, 9.78) |
0.948 |
| Biochemistry parameters |
|
|
|
|
| White blood cell count (× 109/L) |
1.00 (1.00, 1.00) |
< 0.001 |
1.00 (1.00, 1.00) |
0.090 |
| Neutrophil count (%) |
1.07 (1.05, 1.09) |
< 0.001 |
|
|
| Lymphocyte count (%) |
0.92 (0.91, 0.94) |
< 0.001 |
|
|
| Platelet count (× 10^9 /L) |
1.0 (0.99, 1.01) |
0.888 |
|
|
| Hemoglobin (g/dL) |
0.88 (0.80, 0.96) |
0.004 |
0.97 (0.74, 1.27) |
0.799 |
| Liver tests |
|
|
|
|
| ALT (U/L) |
1.0 (0.99, 1.01) |
0.857 |
|
|
| AST (U/L) |
1.01 (1.00, 1.02) |
0.007 |
1.00 (0.98, 1.02) |
0.953 |
| LDH (U/L) |
1.01 (1.00, 1.04) |
< 0.001 |
1.00 (0.99, 1.01) |
0.573 |
| Inflammatory factors |
|
|
|
|
| Ferritin (ng/mL) |
1.01 (1.00, 1.02) |
0.024 |
1.01 (1.00, 1.02) |
0.010 |
| CRP (mg/L) |
1.02 (1.01, 1.03) |
< 0.001 |
1.00 (0.96, 4.04) |
0.948 |
| ESR (mL/h) |
1.01 (1.00, 1.02) |
< 0.001 |
1.01 (0.97, 1.04) |
0.691 |
| Kidney tests |
|
|
|
|
| BUN (mg/dL) |
1.03 (1.01, 1.04) |
< 0.001 |
1.06 (0.92, 1.21) |
0.427 |
| Cr (mg/dL) |
1.17 (1.01, 1.35) |
0.033 |
0.17 (0.01, 2.32) |
0.183 |
| Arterial blood gas |
|
|
|
|
| PH |
0.91 (0.06, 14.29) |
0.945 |
|
|
| HCO3 (mm Hg) |
0.99 (0.95, 1.04) |
0.758 |
|
|
| PCO2 (mm Hg) |
0.99 (0.98, 1.01) |
0.721 |
|
|
aBased on Logistic regression model.
b The adjusted model was adjusted for age, education, systolic blood pressure, CT score for severity, comorbidities, white blood cell count, hemoglobin, AST, LDH, inflammatory factors, BUN and creatinine.
In the follow-up period, mortality rates for COVID-19 ranged from 17.5% (40/229) in severe cases to 2.1% (9/424) in non-severe patients; 10.9% (25) of severe cases and 0.5 % (2) of non-severe cases used the mechanical ventilation and 28.4% (65) in severe cases and 5.7% (24) in non-severe patients were admitted to the ICU. As shown in Figure 1, after controlling for potential confounders, severity of the disease was associated with increased risk of mortality (HR = 5.99; 95% CI = 2.85,12.59; P < 0.001), invasive ventilation (HR = 7.09; 95% CI = 3.24,15.52; P < 0.001) and ICU admission (HR = 4.88; 95% CI = 2.98,7.98; P < 0.001).
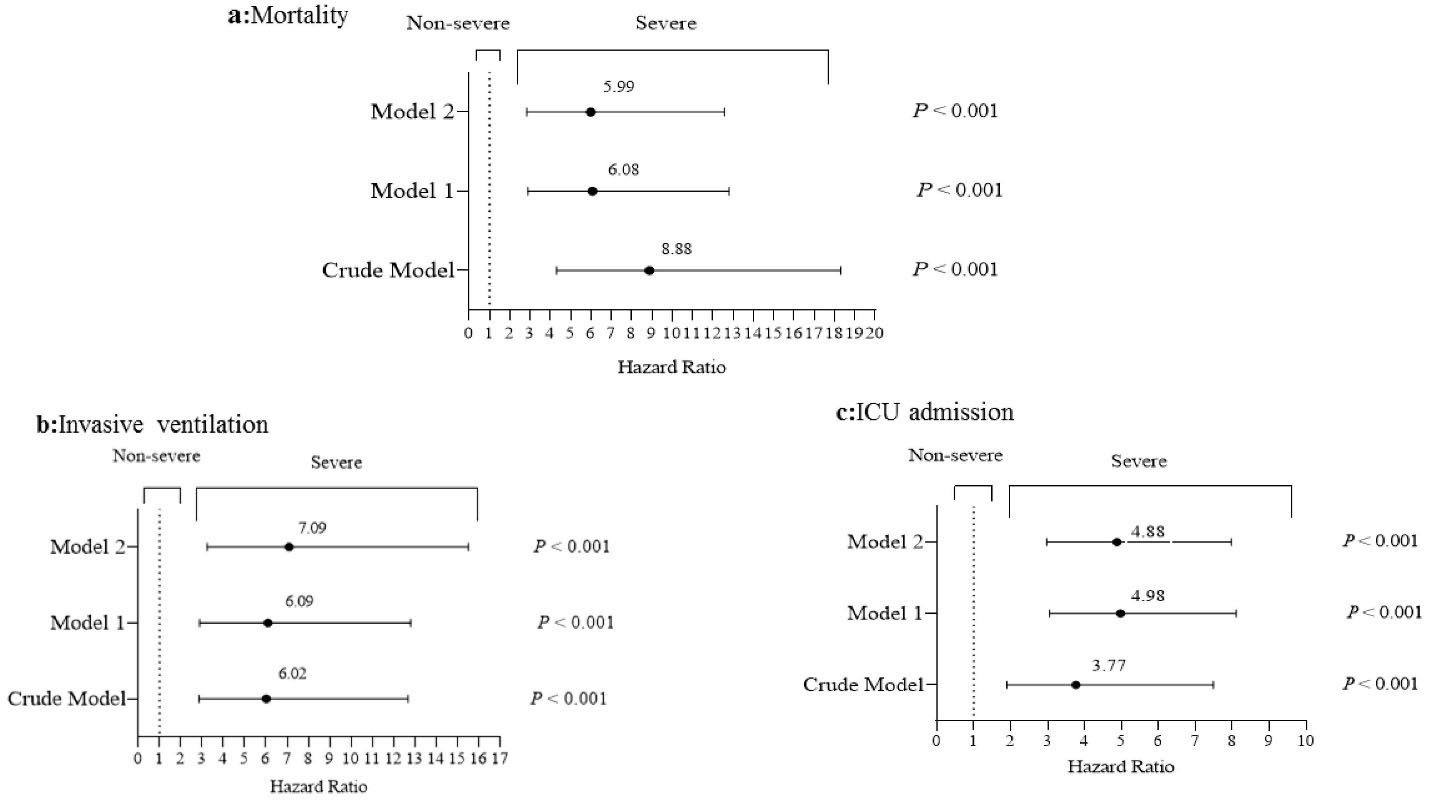
Figure 1.
Hazard Ratios for Mortality, Ventilation Status and ICU Admissions According to Severity of Disease. Cox proportional hazards regression models for estimating HRs and 95% CIs. Model 1, multivariable adjusted for age and gender; Model 2, further controlled for, education, systolic blood pressure, history of hypertension, CT score, White blood cell count, neutrophil count, lymphocyte, AST, LDH, hemoglobin, ferritin, CRP, ESR, BUN and Cr. Data are presented as hazard ratio (95% CI).
.
Hazard Ratios for Mortality, Ventilation Status and ICU Admissions According to Severity of Disease. Cox proportional hazards regression models for estimating HRs and 95% CIs. Model 1, multivariable adjusted for age and gender; Model 2, further controlled for, education, systolic blood pressure, history of hypertension, CT score, White blood cell count, neutrophil count, lymphocyte, AST, LDH, hemoglobin, ferritin, CRP, ESR, BUN and Cr. Data are presented as hazard ratio (95% CI).
As can be seen in Table 4, HRs for the association between severity of disease and risk of mortality indicated that age (HR = 1.04; 95% CI = 1.02–1.07; P= 0.002), chronic kidney disease (HR = 3.05; 95% CI = 1.35, 6.90; P= 0.008), BUN (HR = 1.04; 95% CI = 1.03–1.05; P< 0.001) and creatinine (HR = 1.44; 95% CI = 1.26–1.65; P< 0.001) were significant risk factors associated with death in cases with severe COVID-19. However, after adjusting for confounder variables, these disappeared. The Kaplan-Meier estimates of survival rate for all outcomes by severity/non-severity groups are shown in Figure 2.
Table 4.
Hazard ratiosa for Mortality among Patients with Severe COVID-19
|
|
Unadjusted Model
|
Adjusted Model
b
|
|
Variable
|
HR (95% CI)
|
P
Value
|
HR (95% CI)
|
P
Value
|
| Gender (Men), n (%) |
0.83(0.45, 1.55) |
0.563 |
|
|
| Age (y) |
1.04(1.02, 1.07) |
0.001 |
0.99 (0.93,1.06) |
0.750 |
| Normal weight, n (%) |
Ref. |
0.290 |
|
|
| Overweight and Obesec, n (%) |
1.75(0.62, 4.90) |
|
|
|
| Smoker (Current), n (%) |
0.93(0.21, 4.06) |
0.923 |
|
|
| Temperature on admission (categorized, > 38℃), n (%) |
1.38(0.58, 3.28) |
0.470 |
|
|
| Systolic blood pressure (mm Hg) |
1.00 (0.99, 1.02) |
0.800 |
|
|
| Diastolic blood pressure (mm Hg) |
0.98 (0.969, 1.00) |
0.064 |
0.96 (0.91, 1.01) |
0.135 |
| Co-morbidities |
|
|
|
|
| History of diabetes, n (%) |
1.46 (0.77, 2.76) |
0.251 |
|
|
| History of hypertension, n (%) |
1.50 (0.81, 2.80) |
0.197 |
1.93 (0.39, 9.54) |
0.421 |
| Cardiovascular disease, n (%) |
0.34 (0.12, 0.97) |
0.043 |
0.40 (0.06, 2.83) |
0.360 |
| Respiratory disease, n (%) |
0.90 (0.35, 2.30) |
0.827 |
|
|
| Chronic kidney disease, n (%) |
3.05 (1.35, 6.90) |
0.008 |
0.79 (0.09, 7.30) |
0.836 |
| Biochemistry Parameters |
|
|
|
|
| White blood cell count (× 10^9/L) |
1.00 (1.00, 1.00) |
0.006 |
1.00 (1.00, 1.00) |
0.077 |
| Neutrophil count (%) |
1.08 (1.03, 1.12) |
0.001 |
|
|
| Lymphocyte count (%) |
0.92 (0.87, 0.97) |
0.002 |
|
|
| Platelet count (× 10^9 /L) |
0.99 (0.99, 1.00) |
0.020 |
0.99 (0.98, 1.01) |
0.253 |
| Hemoglobin (g/dL) |
0.88 (0.76, 1.03) |
0.106 |
0.89 (0.61, 1.32) |
0.573 |
| Liver tests |
|
|
|
|
| ALT (U/L) |
1.00 (0.99, 1.01) |
0.870 |
|
|
| AST (U/L) |
1.00 (1.00, 1.00) |
0.551 |
|
|
| LDH (U/L) |
1.00 (1.00, 1.00) |
0.607 |
|
|
| Inflammatory factors |
|
|
|
|
| Ferritin (ng/mL) |
1.00 (1.00, 1.01) |
0.030 |
1.00 (1.00, 1.02) |
0.239 |
| CRP (mg/L) |
1.00 (0.98, 1.02) |
0.962 |
|
|
| ESR (mL/h) |
1.01 (1.00, 1.02) |
0.295 |
|
|
| Kidney tests |
|
|
|
|
| BUN (mg/dL) |
1.04 (1.03, 1.05) |
< 0.001 |
1.03 (0.96, 1.11) |
0.405 |
| Cr (mg/dL) |
1.44 (1.26, 1.65) |
< 0.001 |
0.60 (0.19, 1.87) |
0.378 |
a Cox proportional hazards regression models for estimating HRs and 95% CIs.
b Adjusted for age, Diastolic blood pressure, Cardiovascular disease, Chronic kidney disease, White blood cell count, Platelet count, Hemoglobin, Ferritin, BUN and Cr.
c Normal weight: BMI lower than 24.9, Overweight and obese: BMI more than 25.
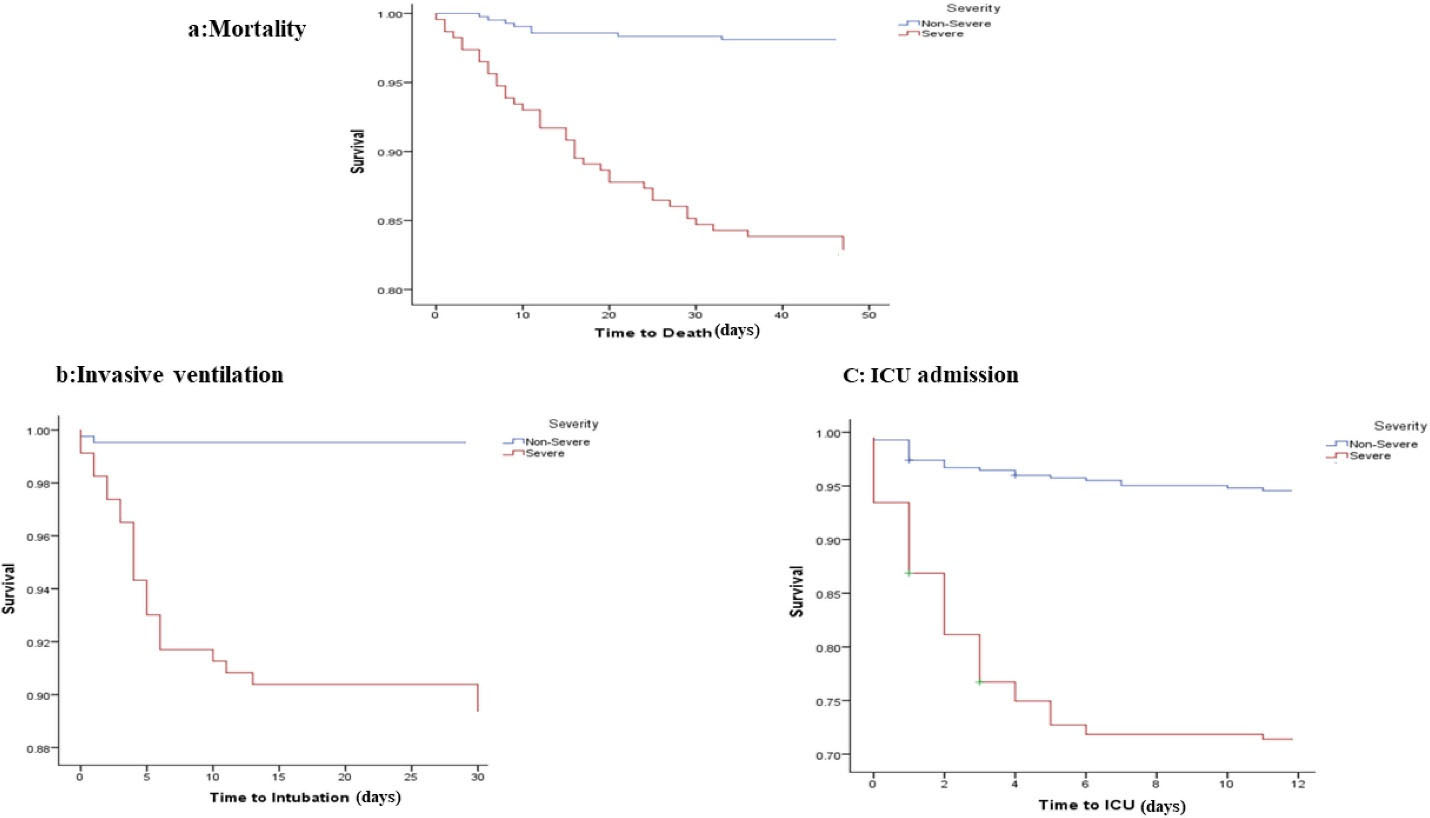
Figure 2.
Kaplan-Meier Estimates of Survival Rate for Mortality, Ventilation Status and ICU Admissions According to Severity of Disease.
.
Kaplan-Meier Estimates of Survival Rate for Mortality, Ventilation Status and ICU Admissions According to Severity of Disease.
Discussion
The results of this prospective cohort study showed 17.5% in-hospital mortality in patients with severe disease and 2.1% in those with non-severe disease during the mean 22.72 days of follow-up. We found that the severity of the disease was associated with a six-fold increase in the hazard of mortality and about a five- to seven-fold rise in the hazard of intubation and ICU admissionin in-hospital patients with COVID-19.Furthermore, higher age and comorbidities, especially diabetes, hypertension, and chronic kidney disease, were associated with increased odds of severity of the disease on admission and a higher risk of mortality in patients.
To our knowledge, this is the first cohort study assessing the relationship between the severity of COVID-19 and mortality in the Middle East, with its unique composition of developing countries. Our findings are consistent with previous investigations, in which the severity of the disease was associated with increased risk of mortality and disease complications.12 The mortality rate was 17% in severe patients in our study, which differs from the results of previous studies.12,24,25 This inconsistency might be due to dissimilarities in baseline risks and diverse populations.
Our findings are consistent with previous investigations26 in which about one-third of inpatients with COVID-19 suffered from hypertension and diabetes. Moreover, consistent with the results of the study by Li et al,12 after adjusting for potential confounders, hypertension was identified as a risk factor with a significant effect size correlating with disease severity in the present study. However, considering the inconclusiveness of the finding resulting from the wide confidence interval, more studies are warranted. Additionally, because the odds ratio was used as the effect size in this analysis, the strength of association might have been overestimated.27 These comorbidities were found to be associated with greater risk of disease severity of COVID-19; however, further studies are required to understand the mechanisms of this association.
The biology of SARS-CoV-2 may have an important role in the increased risk of disease in some special comorbidities. Viral entry into the cell is accomplished by attaching to the cell via the angiotensin-converting-enzyme-2 (ACE2) receptor.12,28 The increased expression of ACE2 in patients with diabetes and hypertension could increase cellular binding affinity for the virus and facilitate its entry. Furthermore, reduced T cell function and dysregulation of pro-inflammatory cytokines, which is observed in diabetes and hypertension, might have a role in the severe manifestation of COVID-19.29
Based on previous evidence, older age, hypertension, diabetes, and inflammatory proteins including ferritin could be considered risk factors associated with inpatient death.11,14 However, in the present study, unlike previous studies,24 only the comorbidity of hypertension had a considerable effect size for death after adjusting for confounding variables. Nonetheless, the results were inconclusive due to the wide confidence interval, which may have been caused by the small size of the severe group. In addition, no significant effect size was observed for other determinant factors in relation to mortality. It should be noted that the effect sizes reported in previous studies mostly did not involve controlling for potentially confounding factors. Besides, in those studies, risk factors were examined only in individuals with severe disease.
Our study, in agreement with previous evidence,12,30,31 showed that older and male subjects seem to be more vulnerable to SARS-CoV-2; although these results are different from some previous investigations,12,32 age and sex indicated no substantial relationship with the risk of disease severity and mortality on admission. This discrepancy may be due to dissimilarities in the definition of disease severity. Because the severity variable is a composite measure, various definitions have been used for it in different studies. Also, the variable of age was categorical in those studies, while it is continuous in the present study.
As previously reported,33 overweight and obesity are more prevalent in patients with COVID-19. The exact mechanism of the relationship between obesity and COVID-19 is unclear; however, inflammation induced by the adipose tissue and excessive levels of ACE2 in the adipose tissue as a potential reservoir for COVID-19 infection33 might contribute to this finding. Although in previous studies13,24,34 obesity, especially BMI more than 35, has been associated with critical endpoints of COVID-19 and death, in the present study, obesity was not linked to the severity and mortality of the disease. This inconsistency might be related to the fact that the number of people with BMI above 35 kg/m2 was small in our study.
In the present study, consistent with previous studies,35,36 a considerable difference was observed between patients with severe and non-severe disease in terms of laboratory data, including hematologic, liver, and kidney tests and inflammatory factors. In concert with recent studies,37,38 among patients with severe illness, leukocytosis was more prevalent than leukopenia. Leukocytosis might be present in excessive inflammation, which also results in much higher ferritin, CRP, and ESR levels among severe cases. Furthermore, increased LDH levels that have been associated with poor prognosis, tissue injury, and infection,39 were observed in patients with severe disease. This finding might indicate lung injury and tissue damage in these patients. However, no considerable association was observed between biochemical markers other than creatinine concentration and the mortality risk. The findings of this study suggest that evaluation of laboratory markers on admission should be considered important in disease prognosis because of the differences observed in these markers in severe cases and the strong association between disease severity and critical outcomes and death.
The lesion morphologies frequently associated with COVID-19 (GGO, consolidation, and crazy paving patterns) were also found in our study. In contrast to some studies which considered consolidation and crazy paving patterns to be more common in severe cases and GGO patterns to be more common in non-severe cases,20,40,41 the morphologic patterns of the lesions were the same in the two groups of patients in our study. Similar to the studies by Li et al22 and Yang et al,42 pleural effusion was seen much more frequently in subjects with severe disease than those with non-severe disease. It has been suggested that the occurrence of pleural effusion may be associated with poor prognosis in SARS-CoV-2.43 Furthermore, the distribution of the lesions was mainly detected in the lower lobes of the lungs compared to upper lobes, especially in non-severe patients. However, other studies have not mentioned this type of difference between the two groups and noted greater involvement of the lower lobes regardless of disease severity.22,43 This discrepancy may be due to the important time of imaging. According to previous evidence,44,45 GGO and other abnormality patterns usually develop between days 0 and 4 after symptom onset and peak at days 9–13. In the present study, a chest CT scan was performed on the admission day. Additionally, the findings of the present study showed a significant statistical difference between the CT scores of the patients with severe and non-severe disease. Our findings indicate that a higher CT score on admission can predict the severity of the disease and subsequent complications. However, as discussed earlier, the morphologic pattern of the lesions failed to predict disease severity contrary to some other studies. In summary, the CT scan can be very useful in both the diagnosis and prediction of the outcome in patients with COVID-19.
The strengths of this study include its prospective nature, large sample size, and high participation rate. The limitations of the study include the fact that the use of medications for virus infection, which can affect disease outcome, was not adjusted for in the analysis. Furthermore, our assumption to consider discharged patients alive was another limitation. Moreover, given the observational nature of the study, the associations discovered do not necessarily constitute causality. Additionally, although potential confounders were adjusted for, residual and undetermined confounders might have had an impact on our results.
In conclusion, the severity of the disease, defined based on clinical manifestations, was considerably associated with increased mortality, invasive ventilation, and ICU admission during hospital stay in Iran. This finding suggests that more intensive therapy and special monitoring should be implemented for patients with diabetes, hypertension, and kidney disease who are infected with COVID-19 to prevent rapid worsening.
Supplementary Materials
Supplementary file 1 contains Figure S1.
(pdf)
Acknowledgements
The authors wish to thank all the study participants for their cooperation. We would also like to show our appreciation to all of the follow-up team. This work was supported by Esfahan University of Medical Sciences
Authors’ Contribution
RS, MM and ZM conceptualized and designed the study and wrote the manuscript. AS, SM, NK and MD collected data. RS and FS provided the study administration works. MM, ZK and SJ performed data analysis. RS, FS and ZM interpreted the data, provided professional comments, and critically revised the manuscript for intellectual content and data accuracy. All authors had access to the study data and reviewed and approved the final manuscript.
Conflict of Interest Disclosures
The authors declare that they have no conflict of interest.
Ethical Statement
Written informed consent was obtained from all participants at the baseline. This study was approved by the ethics committee of Isfahan University of Medical Sciences (Ethical code: IR.MUI.MED.REC.1399.029).
Funding
This work was supported financially by Esfahan University of Medical Sciences.
References
- Lu R, Zhao X, Li J, Niu P, Yang B, Wu H. Genomic characterisation and epidemiology of 2019 novel coronavirus: implications for virus origins and receptor binding. Lancet 2020; 395(10224):565-74. doi: 10.1016/s0140-6736(20)30251-8 [Crossref] [ Google Scholar]
- WHO. Coronavirus Disease (COVID-19) Pandemic. Available from: https://www.who.int/emergencies/diseases/novel-coronavirus-2019.
- Zhou F, Yu T, Du R, Fan G, Liu Y, Liu Z. Clinical course and risk factors for mortality of adult inpatients with COVID-19 in Wuhan, China: a retrospective cohort study. Lancet 2020; 395(10229):1054-62. doi: 10.1016/s0140-6736(20)30566-3 [Crossref] [ Google Scholar]
- Chang D, Lin M, Wei L, Xie L, Zhu G, Dela Cruz CS. Epidemiologic and clinical characteristics of novel coronavirus infections involving 13 patients outside Wuhan, China. JAMA 2020; 323(11):1092-3. doi: 10.1001/jama.2020.1623 [Crossref] [ Google Scholar]
- Inciardi RM, Lupi L, Zaccone G, Italia L, Raffo M, Tomasoni D. Cardiac involvement in a patient with coronavirus disease 2019 (COVID-19). JAMA Cardiol 2020; 5(7):819-24. doi: 10.1001/jamacardio.2020.1096 [Crossref] [ Google Scholar]
- Lodigiani C, Iapichino G, Carenzo L, Cecconi M, Ferrazzi P, Sebastian T. Venous and arterial thromboembolic complications in COVID-19 patients admitted to an academic hospital in Milan, Italy. Thromb Res 2020; 191:9-14. doi: 10.1016/j.thromres.2020.04.024 [Crossref] [ Google Scholar]
- Klok FA, Kruip M, van der Meer NJM, Arbous MS, Gommers D, Kant KM. Confirmation of the high cumulative incidence of thrombotic complications in critically ill ICU patients with COVID-19: an updated analysis. Thromb Res 2020; 191:148-50. doi: 10.1016/j.thromres.2020.04.041 [Crossref] [ Google Scholar]
- Filatov A, Sharma P, Hindi F, Espinosa PS. Neurological complications of coronavirus disease (COVID-19): encephalopathy. Cureus 2020; 12(3):e7352. doi: 10.7759/cureus.7352 [Crossref] [ Google Scholar]
- Mao L, Jin H, Wang M, Hu Y, Chen S, He Q. Neurologic manifestations of hospitalized patients with coronavirus disease 2019 in Wuhan, China. JAMA Neurol 2020; 77(6):683-90. doi: 10.1001/jamaneurol.2020.1127 [Crossref] [ Google Scholar]
- Carlos WG, Dela Cruz CS, Cao B, Pasnick S, Jamil S. Novel Wuhan (2019-nCoV) coronavirus. Am J Respir Crit Care Med 2020; 201(4):P7-P8. doi: 10.1164/rccm.2014P7 [Crossref] [ Google Scholar]
- Tian W, Jiang W, Yao J, Nicholson CJ, Li RH, Sigurslid HH. Predictors of mortality in hospitalized COVID-19 patients: a systematic review and meta-analysis. J Med Virol 2020; 92(10):1875-83. doi: 10.1002/jmv.26050 [Crossref] [ Google Scholar]
- Li X, Xu S, Yu M, Wang K, Tao Y, Zhou Y. Risk factors for severity and mortality in adult COVID-19 inpatients in Wuhan. J Allergy Clin Immunol 2020; 146(1):110-8. doi: 10.1016/j.jaci.2020.04.006 [Crossref] [ Google Scholar]
- Sattar N, McInnes IB, McMurray JJV. Obesity is a risk factor for severe COVID-19 infection: multiple potential mechanisms. Circulation 2020; 142(1):4-6. doi: 10.1161/circulationaha.120.047659 [Crossref] [ Google Scholar]
- Wu C, Chen X, Cai Y, Xia J, Zhou X, Xu S. Risk factors associated with acute respiratory distress syndrome and death in patients with coronavirus disease 2019 pneumonia in Wuhan, China. JAMA Intern Med 2020; 180(7):934-43. doi: 10.1001/jamainternmed.2020.0994 [Crossref] [ Google Scholar]
- Sorbello M, El-Boghdadly K, Di Giacinto I, Cataldo R, Esposito C, Falcetta S. The Italian coronavirus disease 2019 outbreak: recommendations from clinical practice. Anaesthesia 2020; 75(6):724-32. doi: 10.1111/anae.15049 [Crossref] [ Google Scholar]
- Hamidian Jahromi A, Mazloom S, Ballard D. What the European and American health care systems can learn from China COVID-19 epidemic; action planning using purpose designed medical telecommunication, courier services, home-based quarantine, and COVID-19 walk-in centers. Immunopathol Persa 2020; 6(2):e17. doi: 10.34172/ipp.2020.17 [Crossref] [ Google Scholar]
- Sami R, Soltaninejad F, Amra B, Naderi Z, Haghjooy Javanmard S, Iraj B. A one-year hospital-based prospective COVID-19 open-cohort in the Eastern Mediterranean region: the Khorshid COVID Cohort (KCC) study. PLoS One 2020; 15(11):e0241537. doi: 10.1371/journal.pone.0241537 [Crossref] [ Google Scholar]
- Ai T, Yang Z, Hou H, Zhan C, Chen C, Lv W. Correlation of chest CT and RT-PCR testing for coronavirus disease 2019 (COVID-19) in China: a report of 1014 cases. Radiology 2020; 296(2):E32-E40. doi: 10.1148/radiol.2020200642 [Crossref] [ Google Scholar]
- McIntosh K. Coronavirus disease 2019 (COVID-19). Hirsch MS, editor. UpToDate website. https://www.uptodate.com/contents/coronavirus-disease-2019-covid-19.2020.
- Simpson S, Kay FU, Abbara S, Bhalla S, Chung JH, Chung M. Radiological Society of North America expert consensus statement on reporting chest CT findings related to COVID-19. Endorsed by the Society of Thoracic Radiology, the American College of Radiology, and RSNA - Secondary Publication. J Thorac Imaging 2020; 35(4):219-27. doi: 10.1097/rti.0000000000000524 [Crossref] [ Google Scholar]
- Byrne D, Neill SBO, Müller NL, Müller CIS, Walsh JP, Jalal S. RSNA expert consensus statement on reporting chest CT findings related to COVID-19: interobserver agreement between chest radiologists. Can Assoc Radiol J 2021; 72(1):159-66. doi: 10.1177/0846537120938328 [Crossref] [ Google Scholar]
- Li K, Wu J, Wu F, Guo D, Chen L, Fang Z. The clinical and chest CT features associated with severe and critical COVID-19 pneumonia. Invest Radiol 2020; 55(6):327-31. doi: 10.1097/rli.0000000000000672 [Crossref] [ Google Scholar]
- European Centre for Disease Prevention and Control (ECDC). Guidance for Discharge and Ending Isolation in the Context of Widespread Community Transmission of COVID-19–First Update. ECDC; 2020. https://wwwecdceuropaeu/en/publications-data/covid-19-guidance-discharge-and-ending-isolation. Accessed May 7, 2020.
- Li K, Wu J, Wu F, Guo D, Chen L, Fang Z. The clinical and chest CT features associated with severe and critical COVID-19 pneumonia. Invest Radiol 2020; 55(6):327-31. doi: 10.1097/rli.0000000000000672 [Crossref] [ Google Scholar]
- Hamidian Jahromi, Mahmoudi H. Estimates of mortality following COVID-19 infection; comparison between Europe and the United States. Immunopathol Persa 2020; 7(1):e05. doi: 10.34172/ipp.2021.05 [Crossref] [ Google Scholar]
- Yang J, Zheng Y, Gou X, Pu K, Chen Z, Guo Q. Prevalence of comorbidities and its effects in patients infected with SARS-CoV-2: a systematic review and meta-analysis. Int J Infect Dis 2020; 94:91-5. doi: 10.1016/j.ijid.2020.03.017 [Crossref] [ Google Scholar]
- Knol MJ, Le Cessie S, Algra A, Vandenbroucke JP, Groenwold RH. Overestimation of risk ratios by odds ratios in trials and cohort studies: alternatives to logistic regression. CMAJ 2012; 184(8):895-9. doi: 10.1503/cmaj.101715 [Crossref] [ Google Scholar]
- Ali A, Vijayan R. Dynamics of the ACE2-SARS-CoV-2/SARS-CoV spike protein interface reveal unique mechanisms. Sci Rep 2020; 10(1):14214. doi: 10.1038/s41598-020-71188-3 [Crossref] [ Google Scholar]
- Muniyappa R, Gubbi S. COVID-19 pandemic, coronaviruses, and diabetes mellitus. Am J Physiol Endocrinol Metab 2020; 318(5):E736-E41. doi: 10.1152/ajpendo.00124.2020 [Crossref] [ Google Scholar]
- Yang X, Yu Y, Xu J, Shu H, Xia J, Liu H. Clinical course and outcomes of critically ill patients with SARS-CoV-2 pneumonia in Wuhan, China: a single-centered, retrospective, observational study. Lancet Respir Med 2020; 8(5):475-81. doi: 10.1016/s2213-2600(20)30079-5 [Crossref] [ Google Scholar]
- Zununi Vahed S, Ghiyasvand S, Tolouian R, Noshad H, Tolouian A, Mohajel Shoja M. The footprint of androgen sensitive serine protease (TMPRSS2) in gender mortality with COVID-19. Immunopathol Persa 2020; 6(2):e27. doi: 10.34172/ipp.2020.27 [Crossref] [ Google Scholar]
- Guan WJ, Liang WH, Zhao Y, Liang HR, Chen ZS, Li YM, et al. Comorbidity and its impact on 1590 patients with COVID-19 in China: a nationwide analysis. Eur Respir J 2020;55(5). 10.1183/13993003.00547-2020
- Kassir R. Risk of COVID-19 for patients with obesity. Obes Rev 2020; 21(6):e13034. doi: 10.1111/obr.13034 [Crossref] [ Google Scholar]
- Gao F, Zheng KI, Wang XB, Sun QF, Pan KH, Wang TY. Obesity is a risk factor for greater COVID-19 severity. Diabetes Care 2020; 43(7):e72-e4. doi: 10.2337/dc20-0682 [Crossref] [ Google Scholar]
- Henry BM, de Oliveira MHS, Benoit S, Plebani M, Lippi G. Hematologic, biochemical and immune biomarker abnormalities associated with severe illness and mortality in coronavirus disease 2019 (COVID-19): a meta-analysis. Clin Chem Lab Med 2020; 58(7):1021-8. doi: 10.1515/cclm-2020-0369 [Crossref] [ Google Scholar]
- Li J, He X, Yuan Y, Zhang W, Li X, Zhang Y. Meta-analysis investigating the relationship between clinical features, outcomes, and severity of severe acute respiratory syndrome coronavirus 2 (SARS-CoV-2) pneumonia. Am J Infect Control 2021; 49(1):82-9. doi: 10.1016/j.ajic.2020.06.008 [Crossref] [ Google Scholar]
- Guan WJ, Ni ZY, Hu Y, Liang WH, Ou CQ, He JX. Clinical characteristics of coronavirus disease 2019 in China. N Engl J Med 2020; 382(18):1708-20. doi: 10.1056/NEJMoa2002032 [Crossref] [ Google Scholar]
- Huang C, Wang Y, Li X, Ren L, Zhao J, Hu Y. Clinical features of patients infected with 2019 novel coronavirus in Wuhan, China. Lancet 2020; 395(10223):497-506. doi: 10.1016/s0140-6736(20)30183-5 [Crossref] [ Google Scholar]
- Erez A, Shental O, Tchebiner JZ, Laufer-Perl M, Wasserman A, Sella T. Diagnostic and prognostic value of very high serum lactate dehydrogenase in admitted medical patients. Isr Med Assoc J 2014; 16(7):439-43. [ Google Scholar]
- Zu ZY, Jiang MD, Xu PP, Chen W, Ni QQ, Lu GM. Coronavirus disease 2019 (COVID-19): a perspective from China. Radiology 2020; 296(2):E15-E25. doi: 10.1148/radiol.2020200490 [Crossref] [ Google Scholar]
- Pan F, Zheng C, Ye T, Li L, Liu D, Li L. Different computed tomography patterns of coronavirus disease 2019 (COVID-19) between survivors and non-survivors. Sci Rep 2020; 10(1):11336. doi: 10.1038/s41598-020-68057-4 [Crossref] [ Google Scholar]
- Yang R, Li X, Liu H, Zhen Y, Zhang X, Xiong Q. Chest CT severity score: an imaging tool for assessing severe COVID-19. Radiol Cardiothorac Imaging 2020; 2(2):e200047. doi: 10.1148/ryct.2020200047 [Crossref] [ Google Scholar]
- Ye Z, Zhang Y, Wang Y, Huang Z, Song B. Chest CT manifestations of new coronavirus disease 2019 (COVID-19): a pictorial review. Eur Radiol 2020; 30(8):4381-9. doi: 10.1007/s00330-020-06801-0 [Crossref] [ Google Scholar]
- Pan F, Ye T, Sun P, Gui S, Liang B, Li L. Time course of lung changes at chest CT during recovery from coronavirus disease 2019 (COVID-19). Radiology 2020; 295(3):715-21. doi: 10.1148/radiol.2020200370 [Crossref] [ Google Scholar]
- Liu X, Zhou H, Zhou Y, Wu X, Zhao Y, Lu Y. Temporal radiographic changes in COVID-19 patients: relationship to disease severity and viral clearance. Sci Rep 2020; 10(1):10263. doi: 10.1038/s41598-020-66895-w [Crossref] [ Google Scholar]