Arch Iran Med. 25(6):366-374.
doi: 10.34172/aim.2022.60
Original Article
Pictogram Is a Valid Instrument to Classify At-Risk Adult Population Based on Abdominal Obesity: Results from Pars Cohort Study
Alireza Kamalipour 1, 2  , Amirhossein Roshanshad 1, 3 , Mahdi Nalini 4, Jafar Hassanzadeh 5, Reza Malekzadeh 6, Fatemeh Malekzadeh 7, Hossein Poustchi 6, Abdullah Gandomkar 8, Alireza Salehi 1, Hossein Molavi Vardanjani 1, 9, *
Author information:
1MPH Department, School of Medicine, Shiraz University of Medical Sciences, Shiraz, Iran
2Hamilton Glaucoma Center, Shiley Eye Institute, Viterbi Family Department of Ophthalmology, University of California, San Diego, California, United States
3Student Research Committee, Shiraz University of Medical Sciences, Shiraz, Iran
4Cardiovascular Research Center, Kermanshah University of Medical Sciences, Kermanshah, Iran
5Department of Epidemiology, Shiraz University of Medical Sciences, Shiraz, Iran
6Liver, Pancreatic, and Biliary Diseases Research Center, Digestive Diseases Research Institute, Tehran University of Medical Sciences, Tehran, Iran
7Digestive Disease Research Center, Digestive Research Institute, Shariati Hospital, Tehran University of Medical Science, Tehran, Iran
8Non-Communicable Disease Research Center, Shiraz University of Medical Sciences, Shiraz, Iran
9MPH Department, School of Medicine, Research Center for Traditional Medicine and History of Medicine, Shiraz University of Medical Sciences, Shiraz, Iran
*
Corresponding Author: Hossein Molavi Vardanjani, PhD; School of Medicine of Shiraz University of Medical Sciences, Imam Hussain Square, Zand St., Shiraz, Iran. Tel/Fax:+98-71-32 33 78 55; E-mail:
hosseinmolavi@ymail.com
Abstract
Background:
Abdominal obesity is associated with increased risk of myocardial infarction and death events. Thus, obtaining data on the status of abdominal obesity is important in risk factor assessment and prevention of non-communicable diseases. This study aimed to evaluate the validity of using pictograms to classify abdominal obesity indices (waist circumference [WC], waist-hip ratio [WHR], and waist-height ratio [WHtR]) into normal and at-risk categories and determine the effects of demographic characteristics on this validity.
Methods:
This cross-sectional study used data from Pars Cohort Study (PCS). Participants chose the most similar pictogram scores to their body size at 15, 30 years, and current age. Optimal normal/at-risk cut-off values for pictograms were calculated using sensitivity/specificity plots. Receiver operating characteristic curves were used to evaluate the validity of pictograms. Validity measures were analyzed across different subgroups of demographic characteristics.
Results:
A total of 9263 participants (46% males) were included in the study. The estimated area under the curves were 84% for WC, 77% for WHR, and 89% for WHtR in males, and 84% for WC, 73% for WHR, and 90% for WHtR in females. Optimal pictogram cutoffs to classify central obesity for WC, WHR, and WHtR were 4, 4, and 5 in males and 4, 4, and 6 in females, respectively. The majority of demographic characteristics were not associated with the validity of pictograms.
Conclusion:
Using pictograms to determine normal and at-risk categories of abdominal obesity indices is valid among adult population with a wide range of demographic characteristics. However, the results need to be interpreted with caution in those with a positive history of weight fluctuation.
Keywords: Abdominal obesity, Pictogram, Waist circumference, Waist-height ratio, Waist-hip ratio
Copyright and License Information
© 2022 The Author(s).
This is an open-access article distributed under the terms of the Creative Commons Attribution License (
https://creativecommons.org/licenses/by/4.0), which permits unrestricted use, distribution, and reproduction in any medium, provided the original work is properly cited.
Cite this article as: Kamalipour A, Roshanshad A, Nalini M, Hassanzadeh J, Malekzadeh R, Malekzadeh F, et al. Pictogram is a valid instrument to classify at-risk adult population based on abdominal obesity: results from pars cohort study. Arch Iran Med. 2022;25(6):366-374. doi: 10.34172/aim.2022.60
Introduction
Maldistribution of total body fat is associated with adverse metabolic and cardiac outcomes.1,2 Visceral body fat increases the risk of insulin resistance and metabolic syndrome.3 Furthermore, previous studies show that correlations of abdominal obesity indices (waist circumference [WC], waist-hip ratio [WHR], and waist-height ratio [WHtR]) with myocardial infarction and death events are higher than the correlation of body mass index (BMI) with these events.4,5 Thus, obtaining data on the status of abdominal obesity is important in risk factor assessment and prevention of non-communicable diseases.6
Evaluation of abdominal obesity indices in field studies can be problematic, especially in low-resource settings, due to several reasons. First, it is expensive and time-consuming to provide the required instruments for accurate measurement on a large scale.7 Second, measuring these indices requires experienced technicians. Finally, in line with the development of telemedicine, alternative assessment methods should be provided that do not require the physical presence of the participants.
Body shape pictogram (silhouette) can be a potential alternative of using direct measurements to classify abdominal obesity status. Pictograms are sets of body images ranging from very lean to extremely obese for each gender.8,9 Participants are required to select the picture of the pictogram most similar to their body shape. This instrument has been previously used in several studies for the main purpose of BMI classification.10,11 A previously designed pictogram by Stunkard et al11 has also been validated to estimate BMI in a study conducted in northern Iran.9
To the best of our knowledge, the validity of using pictograms in the classification of abdominal obesity status has not been previously studied in the Iranian population. In this study, we aimed to evaluate the validity of using pictograms to classify WC, WHR, and WHtR categories and also to determine the demographic factors that may alter its classification accuracy in a representative adult population from southern Iran.
Materials and Methods
Study Design and Population
This cross-sectional study was conducted using the baseline data obtained from Pars Cohort Study (PCS). PCS is an ongoing population-based prospective study that started in the fall of 2012 in southern Iran, on a semi-urban multi-ethnic population aged between 40 and 75 years. Details of the study design are published elsewhere.12
Variable Measurement
PCS data were collected using personal interviews, physical examination, and biological sampling based on the study manuals using standardized and calibrated tools by well-experienced personnel. In this study, we used data on age, gender, marital status, ethnicity, education, physical activity, list of household appliances, assets and entertainments, and anthropometric measures including a single measure for height, weight, waist, and hip circumferences. Anthropometric measurements were done when participants wore light clothing, emptied their pockets completely, and did not wear shoes. These measurements were performed once. Height, WC, and hip circumference were measured to the nearest centimeter. WC was measured at the midpoint between the lower margin of the last palpable rib and the top of the iliac crest. The widest portion of the buttocks was considered for measurement of the hip circumference.13 Participants’ weight was measured to the nearest 100 g. One kilogram of measured weight was deducted, equivalent to the average weight of light clothing.
Data on the individual perception of body size and appearance were previously collected using a self-reported questionnaire. The body silhouettes used in this study were previously designed by Stunkard et al.11 The participants were asked to choose their body image perception at the ages of 15 and 30 years, and at the time of the interview. The pictograms showed increasing body size in ascending order and included 7 and 9 pictures for male and female individuals, respectively (Figure 1).
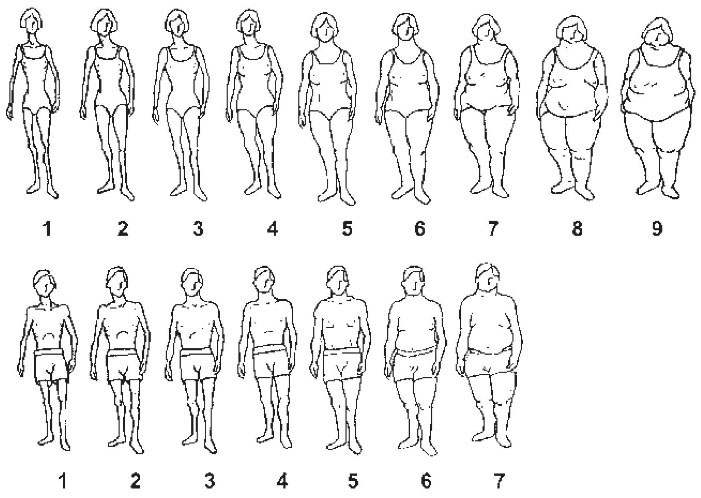
Figure 1.
Body Image Pictogram Used in the Pars Cohort Study.
.
Body Image Pictogram Used in the Pars Cohort Study.
Data Cleaning and Preparation
The data were assessed for internal and external consistency and also rechecked with the hard copy if needed. Cleaned data were prepared for the analyses.
Socioeconomic status (SES) was determined by assets analysis using multiple correspondence analysis of data on the properties. Several items were used to determine the SES of the participants, including phone at home, cell phone, washing machine, dishwasher, microwave device, camcorder, car, household residential area, number of rooms per household members, the main cooling devices and the main cooking device. Then, the participants were categorized into four ordered SES groups.14 Physical activity (PA) was assessed based on the Metabolic Equivalent of Task (MET) score. We implemented International Physical Activity Questionnaire (IPAQ) and used the standard method for its analysis. Then, MET scores were divided into three thirties, named low, medium and high PA.15 The long-term weight cycling variable was defined based on the selected pictograms at three cut-points of 15 years, 30 years, and current age. Individuals who selected the 30-year pictogram as their lowest or highest score (demonstrating a fluctuation in the pattern of pictograms over time) were labeled as cyclers. The remaining participants were classified as non-cyclers.
BMI was divided into underweight/normal (< 25), overweight (≥ 25 and < 30), and obese (≥ 30) similar to the cut-off used by Keshtkar et al.9 Age was categorized into three separate groups of < 50 years, ≥ 50 and < 60 years, and ≥ 60 years. Education and ethnicity variables were classified into 3 groups each (illiterate, ≤ 12 years of education, and university degree), and (Persian, Turk, and others), respectively. WC was categorized into two groups of at-risk and normal based on a limit of ≥ 90 cm for both genders.16 WHR was classified into two groups of at-risk and normal with a cut-off value of ≥ 0.95 for males and ≥ 0.90 for females.17 Finally, WHtR ≥ 0.51 for both genders was classified as at-risk based on a previous study in the Iranian population.18,19
Statistical Analysis
Descriptive statistics including frequencies, median and interquartile range (IQR) were estimated. Gender-specific directly age-standardized proportions of at-risk WC, WHR and, WHtR along with their 95% confidence intervals (CIs) were estimated using world standard population 2000–2025. The linearity assumption for the association between successive levels of the pictogram’s ordinal scores and different central obesity indices was evaluated for each gender. Pearson’s correlation between the pictogram score and different measures of abdominal obesity was assessed for each gender.
Previously defined cut-off values for WC, WHR, and WHtR in the Iranian population were used as gold standard measures for classifying people into normal and at-risk categories of central obesity. Sensitivity and specificity values and their 95% CI were calculated for each of the pictogram pictures to discriminate participants with at-risk values of WC, WHR, and WHtR from normal values. The best cut-off value was determined based on sensitivity/specificity plots and optimized Youden Index which is defined as sensitivity + specificity -1.20 The classification accuracy of using pictogram to divide people into normal and at-risk categories based on each central obesity measure was assessed using the area under the receiver operating characteristic curve (AUC) [%, 95% CI] obtained from logistic regression models. To assess the effect of background variables of the target population on the validity of pictograms, stratified statistical analyses were done using the test for the equality of AUCs based on an algorithm suggested by DeLong et al.21 Stata software version 14.1 (College Station, TX: Stata Corp LLC) was used and a P value < 0.05 was considered as statistically significant.
Results
A total of 9263 participants including 4276 males (46%) were included in the study. Forty-five percent were younger than 50 years. Age-standardized proportions of at-risk WC, WHR, and WHtR were 54% (95% CI: 53, 55), 63% (95% CI: 62, 64), and 9% (95% CI: 9, 10), respectively. Details of the sociodemographic characteristics of the study population are described in Table 1.
Table 1.
Demographics of the Overall and At-Risk Population Based on WC, WHR, and WHtR
|
Variables
|
Overall
(n=9264)
No. (%)
|
At Risk
|
WC
No (%; 95%CI)
|
WHR
No (%; 95%CI)
|
WHtR
No (%; 95%CI)
|
| Age |
|
|
|
|
| Mean age (SD) |
52.63(9.68) |
52.48(9.36) |
53.65(9.65) |
50.89(8.26) |
| < 50 |
4216(46) |
2294(55; 53, 56) |
2261(54; 52,55) |
477(11; 10, 12) |
| 50–59 |
2808(30) |
1600(57; 55, 59) |
1830(66; 64, 67) |
288(10; 9, 11) |
| > 59 |
2240(24) |
1195(54; 51, 56) |
1564(70; 68, 72) |
161(7; 6, 8) |
| Gender |
|
|
|
|
| Female |
4987(54) |
3092(62; 61, 64) |
3741(75; 74, 77) |
552(11; 10, 12) |
| Male |
4276(46) |
1997(47; 45, 48) |
1914(45; 44, 46) |
374(9; 8, 10) |
| Ethnicity |
|
|
|
|
| Persian |
5216(56) |
2996(58; 56, 59) |
3281(63; 62, 64) |
607(12; 11, 13) |
| Turk |
3596(39) |
1809(51; 49, 52) |
2060(58; 56, 59) |
258(7; 6, 8) |
| Other |
451(5) |
284(63; 59, 67) |
314(70; 65, 74) |
61(14; 11, 17) |
| BMI |
|
|
|
|
| Underweight/normal |
4091(44) |
597(15; 14, 16) |
1399(34; 33, 36) |
0(0; -) |
| Overweight |
3441(37) |
2833(82; 81, 84) |
2707(79; 77, 80) |
64(2; 1, 2) |
| Obese |
1675(18) |
1655(99; 98, 99) |
1544(92; 91, 93) |
861(51; 49, 54) |
| Education |
|
|
|
|
| Illiterate |
4538(49) |
2471(55; 53, 56) |
3083(68; 67, 70) |
377(8; 8, 9) |
| Below diploma |
4437(48) |
2447(55; 54, 57) |
2419(55; 53, 56) |
506(11; 11, 12) |
| University |
281(3) |
168(60; 55, 66) |
151(54; 48, 60) |
42(15; 11, 20) |
| Marital status |
|
|
|
|
| Not married |
1049(11) |
590 (57; 53, 59) |
778 (75; 72, 77) |
74 (7; 6, 9) |
| Married |
8211(89) |
4497(55; 54, 56) |
4874 (60; 59, 61) |
851 (10; 10, 11) |
| Socioeconomic statusa |
|
|
|
|
| Low |
2419(26) |
1095(46; 44, 48) |
1405 (59; 57, 60) |
165 (7; 6, 8) |
| Low-middle |
2499(27) |
1306(52; 51, 54) |
1500 (60; 58, 62) |
204 (8; 7, 9) |
| Middle-high |
2046(22) |
1166(57; 55, 59) |
1270 (62; 60, 64) |
234 (11; 10, 13) |
| High |
2299(25) |
1522(67; 65, 68) |
1480 (65; 63, 67) |
323 (14; 13, 16) |
| PAb |
|
|
|
|
| Low |
3061(33) |
1906(63; 61, 64) |
2143 (71; 69, 72) |
367 (12; 11, 13) |
| Medium |
3056(33) |
1786(59; 57, 60) |
1979 (65; 63, 67) |
308 (10; 9, 11) |
| High |
3146(34) |
1397(45; 43, 46) |
1533 (49; 47, 51) |
251 (8; 7, 9) |
| Weight cycling |
|
|
|
|
| Non cycler |
7323(79) |
4192(58; 56, 59) |
4504(62; 61, 63) |
867(12; 11, 13) |
| Cycler |
1941(21) |
897(46; 44, 49) |
1151(60; 57, 62) |
59(3; 2, 4) |
BMI, Body mass index; CI, Confidence interval; PA, Physical activity; No, Number; WC, Waist circumference; WHR, Waist-hip ratio; WHtR, Waist-height ratio
* Socioeconomic status (SES) was determined by assets analysis using multiple correspondence analysis of data on the properties. Several items were used to determine the SES of the participants, including phone at home, cell phone, washing machine, dishwasher, microwave device, camcorder, car, household residential area, number of rooms per household members, the main cooling devices and the main cooking device. Then participants were categorized into four ordered SES groups.
† PA was assessed based on the Metabolic Equivalent of Task (MET) score. We implemented international physical activity questionnaire and used standard method for its analysis. Then, MET scores were divided into three thirties, named low, medium and high PA.
WHtR had the highest correlation with pictogram scores followed by WC and WHR (P value < 0.001 in all pairs). Their corresponding pairs of Pearson’s correlation coefficients for males and females were (0.72, 0.78), (0.71, 0.73), and (0.56, 0.42), respectively. Table 2 shows the distribution of values for each anthropometric index across different pictogram scores.
Table 2.
Gender Specific Median (IQR) of WC, WHR, and WHtR for Each Pictogram Score
|
Male
|
BMI (Blue, normal; Red, overweight; Green, obese) |
|
Score
|
No. (%)
|
WC (IQR)
|
WHR (IQR)
|
WHtR (IQR)
|
| 1 |
173 (4) |
74 (70, 78) |
0.86 (0.84, 0.90) |
0.31 (0.29, 0.34) |
|
| 2 |
1081 (25) |
79 (75, 86) |
0.89 (0.85, 0.93) |
0.35 (0.32, 0.38) |
| 3 |
1096 (26) |
87 (81, 92) |
0.93 (0.89, 0.97) |
0.40 (0.37, 0.43) |
| 4 |
986 (23) |
93 (87, 98) |
0.96 (0.92, 0.99) |
0.43 (0.40, 0.47) |
| 5 |
610 (14) |
99 (94, 104) |
0.99 (0.96, 1.02) |
0.47 (0.44, 0.51) |
| 6 |
281 (7) |
105 (99, 110) |
1.02 (0.98, 1.05) |
0.51 (0.47, 0.54) |
| 7 |
37 (1) |
113 (108, 120) |
1.04 (1.01, 1.07) |
0.57 (0.51, 0.63) |
|
Female
|
BMI (Blue, normal; Red, overweight; Green, obese) |
|
Score
|
No. (%)
|
WC (IQR)
|
WHR (IQR)
|
WHtR (IQR)
|
| 1 |
239 (5) |
74 (67, 80) |
0.87 (0.81, 0.93) |
0.30 (0.28, 0.33) |
|
| 2 |
744 (15) |
83 (76, 89) |
0.91 (0.85, 0.98) |
0.35 (0.32, 0.38) |
| 3 |
903 (18) |
88 (81, 94) |
0.94 (0.88, 0.99) |
0.38 (0.35, 0.41) |
| 4 |
1066 (21) |
93 (88, 100) |
0.96 (0.91, 1.01) |
0.41 (0.39, 0.44) |
| 5 |
964 (19) |
97 (93, 103) |
0.98 (0.93, 1.03) |
0.45 (0.42, 0.48) |
| 6 |
599 (12) |
103 (98, 107) |
1.00 (0.95, 1.05) |
0.48 (0.45, 0.51) |
| 7 |
322 (6) |
108 (103, 113) |
1.02 (0.97, 1.08) |
0.52 (0.48, 0.55) |
| 8 |
115 (2) |
113 (108, 121) |
1.03 (0.97, 1.10) |
0.56 (0.51, 0.60) |
| 9 |
25 (1) |
123 (120, 132) |
1.07 (1.04, 1.12) |
0.64 (0.59, 0.66) |
IQR, Interquartile range; No, Number; WC, Waist circumference [measured in centimeters]; WHR, Waist-hip ratio; WHtR, Waist-height ratio.
The estimated AUCs of pictogram scores to classify normal/at-risk abdominal obesity status for males and females were (84% [95% CI: 83, 86], 84% [95% CI: 83, 86]) for WC, (77% [95% CI: 76, 78], 73% [95% CI: 71, 74]) for WHR, and (89% [95% CI: 88, 91], 90% [95% CI: 88, 91]) for WHtR, respectively (Table 3 and Figure 2).
Table 3.
Validity Measures of the Optimal Pictogram Cut-off Values to Classify At-Risk Population Based on WC, WHR, and WHtR
|
Gender
|
Index
|
TP+FN (%)
|
FP+TN (%)
|
AUC% (95% CI)
|
Cut-off*
|
Sen% (95% CI)
|
Spe% (95% CI)
|
| Male |
|
|
|
|
|
|
|
|
|
WC |
1991 (46.90) |
2254 (53.10) |
84 (83, 86) |
4 |
74 (72, 76) |
81 (79, 82) |
|
|
WHR |
1908 (44.95) |
2337 (55.05) |
77 (76, 78) |
4 |
68 (66, 70) |
74 (72, 76) |
|
|
WHtR |
373 (8.79) |
3872 (91.21) |
89 (88, 91) |
5 |
80 (76, 84) |
84 (83, 85) |
| Female |
|
|
|
|
|
|
|
|
|
WC |
3092 (62.33) |
1869 (37.67) |
84 (83, 86) |
4 |
83 (81, 84) |
72 (69, 74) |
|
|
WHR |
3741 (75.41) |
1220 (24.59) |
73 (71, 74) |
4 |
71 (69, 72) |
64 (61, 66) |
|
|
WHtR |
552 (11.13) |
4409 (88.87) |
90 (88, 91) |
6 |
77 (74, 81) |
86 (84, 87) |
AUC, Area under curve; FP, False positive; FN, False negative; TP, True positive; TN, True negative; Sen, Sensitivity; Spe, Specificity; CI, Confidence interval; WC, Waist circumference; WHR, Waist-hip ratio; WHtR, Waist-height ratio
*Optimal pictogram cut-off value is the pictogram number with the highest AUC to classify at-risk from normal population
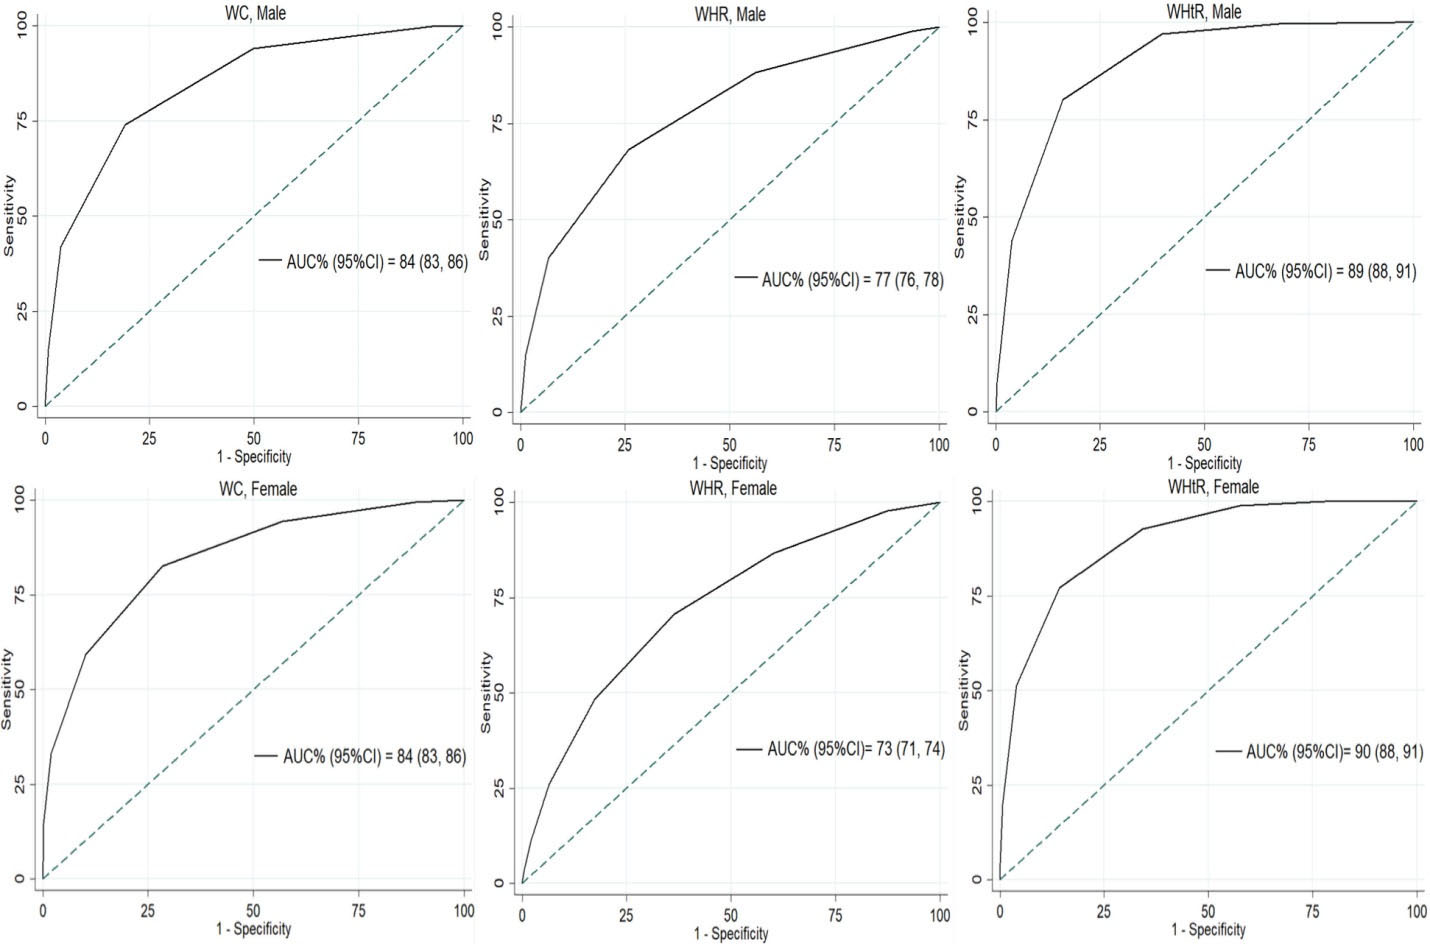
Figure 2.
ROC Curves of Pictogram Scores to Classify At-Risk Population Based on Abdominal Obesity Using WC, WHR, and WHtR as Gold Standard Measures. Classification accuracy is represented as the area under the curve (AUC). ROC, receiver operating characteristic; WC, waist circumference; WHR, waist-hip ratio; WHtR, waist-height ratio.
.
ROC Curves of Pictogram Scores to Classify At-Risk Population Based on Abdominal Obesity Using WC, WHR, and WHtR as Gold Standard Measures. Classification accuracy is represented as the area under the curve (AUC). ROC, receiver operating characteristic; WC, waist circumference; WHR, waist-hip ratio; WHtR, waist-height ratio.
Using WC, WHR, and WHtR as gold standard measures to define central obesity resulted in pictogram score cut-off values of 4, 4, and 5 in males and 4, 4, and 6 in females, respectively (Table 3 and Table S4). In males, the sensitivity and specificity values based on the optimal cut-off values were 74% and 81% for WC, 68% and 74% for WHR, and 80% and 84% for WHtR, respectively. The corresponding values in females were 83% and 72% for WC, 71% and 64% for WHR, and 77% and 86% for WHtR, respectively.
Most of the individual characteristics did not have a statistically significant association with the accuracy of pictogram scores to classify central obesity. For both males and females, SES, PA, age group, ethnicity, marital status, and education had no effects on the classification accuracy of pictograms to determine central obesity. However, weight cycling had a significant association with the accuracy of pictogram scores classifying central obesity defined by WC and WHR (P value < 0.001), but not with WHtR (P value < 0.001 for both; Table 4).
Table 4.
Effects of Sociodemographic Characteristics of the Study Population on the Accuracy of the Pictogram to Classify At-Risk Population Based on WC, WHR, and WHtR
|
|
WC
|
WHR
|
WHtR
|
|
Male
|
| SES |
|
|
|
| PA |
|
|
|
| Cycling |
|
|
|
| Age group |
|
|
|
| Ethnicity |
|
|
|
| Marital status |
|
|
|
| Education |
|
|
|
|
Female
|
| SES |
|
|
|
| PA |
|
|
|
| Cycling |
|
|
|
| Age group |
|
|
|
| Ethnicity |
|
|
|
| Marital status |
|
|
|
| Education |
|
|
|
WC, waist circumference; WHR, waist-hip ratio; WHtR, waist-height ratio; SES, socioeconomic status; PA, Physical activity.
Green, yellow, and red cells indicate P value ≥ 0.05, 0.001 ≤ P value < 0.05, and P value < 0.001, respectively.
Sensitivity analysis was done based on the cut-off of abdominal obesity indices defined by the WHO and is presented in Supplementary file 1.
Discussion
The present study confirms the validity of using Stunkard’s set of pictograms to determine the population at risk of developing adverse health outcomes due to central obesity in the Iranian adult population. In both males and females, the highest AUC for predicting adverse health outcomes with pictograms was achieved when defining central obesity based on WHtR (0.89, 0.90), WC (0.84, 0.84), and WHR (0.77, 0.73), respectively. We also demonstrated the optimal cut-off for differentiating at-risk persons for each central obesity indices. Also, we have shown that the validity of pictograms is not affected by SES, PA, age group, ethnicity, marital status, and education; however, weight cycling influenced this validity when defining central obesity with WC and WHR in both genders.
Most of the previous studies on the assessment of the accuracy of pictograms have focused on BMI. Pictograms were validated to classify obesity based on BMI with AUCs of 0.93 for females and 0.88 for males in the Caucasian population.22 Another study in the Japanese population validated the use of body shape silhouettes to discriminate between obese and thin individuals based on BMI with AUCs of > 0.80 in both genders.23 Lo et al24 found Stunkard’s pictograms to be superior to self-reported WC and waist to height ratio in the assessment of weight status (AUCs of > 0.8 in both genders) in Chinese adolescents. In the young healthy Spanish population, pictograms were validated to determine weight status defined by BMI with AUCs of 0.9 and 0.8 for males and females, respectively.25 Additionally, body silhouettes are shown to be reflective of past obesity based on measured and self-reported BMI in the European population.10 Body show cards were also validated to determine crude (based on BMI) and central (based on WC, WHtR) obesity in the African population with high accuracy (AUCs of > 0.9 in both genders).26 To date, only one Iranian study is conducted on the validity of pictograms to classify obesity. This study shows that Stunkard’s pictograms are valid to determine crude obesity (defined by BMI) in the Iranian population.9 Our study validates the accuracy of using the same set of pictograms to determine central obesity in the Iranian population with AUCs of 77% to 89% in males and 73% to 90% in females for different indices of central obesity.
There is great variance in the age-standardized prevalence of obesity in our population using different definitions of central obesity (WC, WHR, or WHtR). Each index evaluates central obesity from a different perspective, and the optimal cut-off values for the classification of at-risk groups of the population using these indices are not necessarily obtained based on the same outcomes. Thus, an individual may be classified as at-risk according to a certain index while categorized as normal using another one at the same time. Despite being generally valid to classify central obesity, pictograms have higher accuracy to classify at-risk groups when central obesity is defined based on WHtR and WC rather than WHR. This finding results from higher pictogram score correlations with WHtR and WC than its correlation with WHR. This is the first study to assess the accuracy of pictograms to determine central obesity defined by WHR. A previous study in the African population revealed high accuracy (AUCs > 0.90) for the classification of central obesity defined by WHtR and WC using a different set of body show cards.26 These findings propose the currently developed body silhouettes as valid tools to evaluate central obesity defined by WHtR and WC. However, the results may not be readily translated to other measures of central adiposity like WHR. An underlying reason may be attributed to the inherent nature of the currently available show cards with more focus on horizontal and vertical dimensions of pictograms to demonstrate obesity rather than highlighting the ratio of waist to hip. Besides, most people may perceive obesity to be related to the degree of abdominal circumference or its ratio to height rather than other existing definitions of obesity like WHR.
Previous studies report that sociodemographic and psychological factors are associated with self-perception of weight status. Dorsey et al27 found that weight misperception is highly prevalent among the US population and is associated with ethnicity and educational status. In another study, married women were shown to be more likely to perceive themselves as overweight while such an association was not found in men.28 Moreover, evidence suggests that the level of education affects the self-perception of obesity in the Korean adult population.29 In addition, another study including 5440 US adult population shows that race, SES, and level of education are associated with self-perception of being overweight.30 On the other hand, investigators demonstrated that weight misperception is associated with psychological distress and anxiety in the Australian and Chinese populations.31,32 Thus, there is the possibility that misperception of weight status affects the accuracy of self-reported body silhouettes to determine central obesity. Our results indicate that the utility of this instrument is not greatly influenced by the sociodemographic properties of individuals.
SES, physical activity, age group, ethnicity, marital status, and level of education did not affect the validity of body silhouettes to classify central obesity. Although previous studies found an association between these factors and self-perception of weight, almost all of them have used self-reported height and weight or asked whether the participants have the feeling of being overweight.27-30,33,34 Selecting the closest silhouette to body shape appears to be more realistic and less prone to subjective errors observed with previous study designs. Most of our population belonged to Persian and Turk ethnicity, two major ethnic groups living in Iran. Gender-specific validity of body show cards to determine central obesity was almost the same between different ethnicities. In cases of large differences in performance, there might be a necessity to design new sets of body show cards that more closely resemble the morphologies observed in specific ethnicities. However, the results of our study are in favor of the generalizability of Stunkard’s pictograms to detect central obesity among different Iranian ethnicities. Alterations in body appearance may occur as a result of aging.35 Accordingly, we tested the potential influence of age group on the accuracy of pictograms classifying central obesity. Our results showed an almost similar classification accuracy among different age groups that support using the same set of pictograms across different age groups of the adult population. However, our study population was older than 40 years; the age group in which people’s (especially females’) perception of their weight status is probably less affected by social values and individual expectations.36 This may result in less bias and a more realistic interpretation of anthropometric status than that observed in a younger age group. Although weight cycling is used to point to previous fluctuations in weight status,37-41 it is a term with relative meaning depending on the context in which it has been described. Previous studies on weight cycling have mostly focused on its psychosocial and metabolic consequences.38-40,42,43 Overall, there has been controversy on the association of weight cycling with the risk of adverse metabolic outcomes39,43; however, an association has been shown between a history of weight cycling and central fat accumulation in the body.38,44 Furthermore, previous evidence suggests the association between the history of weight cycling and the accuracy of self-reported weight status.41
Our findings indicate that the history of weight cycling negatively impacts the performance of body pictograms to accurately predict central obesity status. Hence, caution should be made on the interpretation of pictogram ratings in those who report previous fluctuations in their weight. It can be assumed that those with weight cycling were probably not satisfied with their actual weight. The discrepancy between one’s actual and ideal body weight as well as the effects of weight cycling on central adiposity can both account for the decreased accuracy of pictograms in cyclers.
To date, this is one of the largest studies using the pictogram ratings for the evaluation of obesity in the Iranian population. The population-based nature of our study with more than 9000 participants and adherence to precise measurement protocols make our results generalizable to other nations in developing countries. However, this study has certain limitations. First, our study population was older than 40 years and future studies are needed to assess the validity of body show cards in children and young adults. Second, this study was conducted in a semi-urban area; thus, the sociodemographic characteristics of our population may not be fully representative of those living in high social classes of urban areas. Moreover, participants self-determined the closest body show card to their actual body shape. There has been a higher correlation between pictogram scores selected by expert anthropometry observers than those selected by one expert and one less skilled observer.45 However, our results have better generalizability to the situations where individuals have to self-determine their scores with implications in large studies and telemedicine.
In conclusion, the pictogram is a valid tool to classify central obesity in the adult population and the ratings can be better interpreted with respect to the sociodemographic context of the target population. This sets a framework to access anthropometric information on a large scale that would have been otherwise difficult to obtain due to the problems associated with human resources, device expenses, and lack of direct access to people.
Supplementary Materials
Supplementary file 1 contains Tables S1-S4.
(pdf)
Authors’ Contribution
AK: Conceptualization, methodology, data curation, formal analysis, writing- reviewing and editing, writing- original draft preparation. AR: Methodology, investigation, data curation, formal analysis, writing- reviewing and editing, writing- original draft preparation. MN: Conceptualization, writing- reviewing and editing. JH: Methodology, quality control, writing- reviewing and editing. RM: Methodology, data processing, writing- reviewing and editing, supervision. FM: Conceptualization, writing- reviewing and editing. HP: Design, writing- reviewing and editing, quality control, data collection. AG: Methodology, writing- reviewing and editing, quality control, data collection. AS: Methodology, writing- reviewing and editing, validation. HMV: Conceptualization, methodology, supervision, validation, writing- reviewing and editing.
Conflict of Interest Disclosures
The authors declare that they have no conflict of interest.
Ethical Statement
The study design was approved by Shiraz University of Medical Sciences Ethics Committee and it was conducted with regards to the tenets of declaration of Helsinki. The PCS process was explained to each participant and after obtaining written informed consent, they were included in the study.
Funding
This research did not receive any specific grant from funding agencies in the public, commercial, or not-for-profit sectors.
References
- Britton KA, Massaro JM, Murabito JM, Kreger BE, Hoffmann U, Fox CS. Body fat distribution, incident cardiovascular disease, cancer, and all-cause mortality. J Am Coll Cardiol 2013; 62(10):921-5. doi: 10.1016/j.jacc.2013.06.027 [Crossref] [ Google Scholar]
- Jensen MD. Role of body fat distribution and the metabolic complications of obesity. J Clin Endocrinol Metab 2008; 93(11 Suppl 1):S57-63. doi: 10.1210/jc.2008-1585 [Crossref] [ Google Scholar]
- Després JP, Lemieux I. Abdominal obesity and metabolic syndrome. Nature 2006; 444(7121):881-7. doi: 10.1038/nature05488 [Crossref] [ Google Scholar]
- Pischon T, Boeing H, Hoffmann K, Bergmann M, Schulze MB, Overvad K. General and abdominal adiposity and risk of death in Europe. N Engl J Med 2008; 359(20):2105-20. doi: 10.1056/NEJMoa0801891 [Crossref] [ Google Scholar]
- Cao Q, Yu S, Xiong W, Li Y, Li H, Li J. Waist-hip ratio as a predictor of myocardial infarction risk: a systematic review and meta-analysis. Medicine (Baltimore) 2018; 97(30):e11639. doi: 10.1097/md.0000000000011639 [Crossref] [ Google Scholar]
- Etemadi A, Golozar A, Kamangar F, Freedman ND, Shakeri R, Matthews C. Large body size and sedentary lifestyle during childhood and early adulthood and esophageal squamous cell carcinoma in a high-risk population. Ann Oncol 2012; 23(6):1593-600. doi: 10.1093/annonc/mdr494 [Crossref] [ Google Scholar]
- Grant JF, Chittleborough CR, Taylor AW. Parental midlife body shape and association with multiple adult offspring obesity measures: North West Adelaide Health Study. PLoS One 2015; 10(9):e0137534. doi: 10.1371/journal.pone.0137534 [Crossref] [ Google Scholar]
- Field AE, Franko DL, Striegel-Moore RH, Schreiber GB, Crawford PB, Daniels SR. Race differences in accuracy of self-reported childhood body size among white and black women. Obes Res 2004; 12(7):1136-44. doi: 10.1038/oby.2004.142 [Crossref] [ Google Scholar]
- Keshtkar AA, Semnani S, Pourshams A, Khademi H, Roshandel G, Boffetta P. Pictogram use was validated for estimating individual’s body mass index. J Clin Epidemiol 2010; 63(6):655-9. doi: 10.1016/j.jclinepi.2009.08.014 [Crossref] [ Google Scholar]
- Lønnebotn M, Svanes C, Igland J, Franklin KA, Accordini S, Benediktsdóttir B. Body silhouettes as a tool to reflect obesity in the past. PLoS One 2018; 13(4):e0195697. doi: 10.1371/journal.pone.0195697 [Crossref] [ Google Scholar]
- Stunkard AJ, Sørensen T, Schulsinger F. Use of the Danish Adoption Register for the study of obesity and thinness. Res Publ Assoc Res Nerv Ment Dis 1983; 60:115-20. [ Google Scholar]
- Gandomkar A, Poustchi H, Moini M, Moghadami M, Imanieh H, Fattahi MR. Pars Cohort Study of non-communicable diseases in Iran: protocol and preliminary results. Int J Public Health 2017; 62(3):397-406. doi: 10.1007/s00038-016-0848-2 [Crossref] [ Google Scholar]
- World Health Organization (WHO). Waist Circumference and Waist-Hip Ratio: Report of a WHO Expert Consultation, Geneva, 8-11 December 2008. WHO; 2011.
- Hosseini Nejhad Z, Molavi Vardanjani H, Abolhasani F, Hadipour M, Sheikhzadeh K. Relative effect of socio-economic status on the health-related quality of life in type 2 diabetic patients in Iran. Diabetes Metab Syndr 2013; 7(4):187-90. doi: 10.1016/j.dsx.2013.10.024 [Crossref] [ Google Scholar]
- Moezi P, Salehi A, Molavi H, Poustchi H, Gandomkar A, Imanieh MH. Prevalence of chronic constipation and its associated factors in Pars Cohort Study: a study of 9000 adults in Southern Iran. Middle East J Dig Dis 2018; 10(2):75-83. doi: 10.15171/mejdd.2018.94 [Crossref] [ Google Scholar]
- Azizi F, Khalili D, Aghajani H, Esteghamati A, Hosseinpanah F, Delavari A. Appropriate waist circumference cut-off points among Iranian adults: the first report of the Iranian National Committee of Obesity. Arch Iran Med 2010; 13(3):243-4. [ Google Scholar]
- Hadaegh F, Zabetian A, Sarbakhsh P, Khalili D, James WP, Azizi F. Appropriate cutoff values of anthropometric variables to predict cardiovascular outcomes: 7.6 years follow-up in an Iranian population. Int J Obes (Lond) 2009; 33(12):1437-45. doi: 10.1038/ijo.2009.180 [Crossref] [ Google Scholar]
- Hajian-Tilaki K, Heidari B. Is waist circumference a better predictor of diabetes than body mass index or waist-to-height ratio in Iranian adults?. Int J Prev Med 2015; 6:5. doi: 10.4103/2008-7802.151434 [Crossref] [ Google Scholar]
- Hajian-Tilaki K, Heidari B, Hajian-Tilaki A, Firouzjahi A, Bagherzadeh M. The discriminatory performance of body mass index, waist circumference, waist-to-hip ratio and waist-to-height ratio for detection of metabolic syndrome and their optimal cutoffs among Iranian adults. J Res Health Sci 2014; 14(4):276-81. [ Google Scholar]
- Fluss R, Faraggi D, Reiser B. Estimation of the Youden Index and its associated cutoff point. Biom J 2005; 47(4):458-72. doi: 10.1002/bimj.200410135 [Crossref] [ Google Scholar]
- DeLong ER, DeLong DM, Clarke-Pearson DL. Comparing the areas under two or more correlated receiver operating characteristic curves: a nonparametric approach. Biometrics 1988; 44(3):837-45. [ Google Scholar]
- Bulik CM, Wade TD, Heath AC, Martin NG, Stunkard AJ, Eaves LJ. Relating body mass index to figural stimuli: population-based normative data for Caucasians. Int J Obes Relat Metab Disord 2001; 25(10):1517-24. doi: 10.1038/sj.ijo.0801742 [Crossref] [ Google Scholar]
- Nagasaka K, Tamakoshi K, Matsushita K, Toyoshima H, Yatsuya H. Development and validity of the Japanese version of body shape silhouette: relationship between self-rating silhouette and measured body mass index. Nagoya J Med Sci 2008; 70(3-4):89-96. [ Google Scholar]
- Lo WS, Ho SY, Mak KK, Lam TH. The use of Stunkard’s figure rating scale to identify underweight and overweight in Chinese adolescents. PLoS One 2012; 7(11):e50017. doi: 10.1371/journal.pone.0050017 [Crossref] [ Google Scholar]
- Muñoz-Cachón MJ, Salces I, Arroyo M, Ansotegui L, Rocandio AM, Rebato E. Overweight and obesity: prediction by silhouettes in young adults. Obesity (Silver Spring) 2009; 17(3):545-9. doi: 10.1038/oby.2008.541 [Crossref] [ Google Scholar]
- Yepes M, Viswanathan B, Bovet P, Maurer J. Validity of silhouette showcards as a measure of body size and obesity in a population in the African region: a practical research tool for general-purpose surveys. Popul Health Metr 2015; 13:35. doi: 10.1186/s12963-015-0069-6 [Crossref] [ Google Scholar]
- Dorsey RR, Eberhardt MS, Ogden CL. Racial/ethnic differences in weight perception. Obesity (Silver Spring) 2009; 17(4):790-5. doi: 10.1038/oby.2008.603 [Crossref] [ Google Scholar]
- Klos LA, Sobal J. Marital status and body weight, weight perception, and weight management among U.S. adults. Eat Behav 2013; 14(4):500-7. doi: 10.1016/j.eatbeh.2013.07.008 [Crossref] [ Google Scholar]
- Joh HK, Oh J, Lee HJ, Kawachi I. Gender and socioeconomic status in relation to weight perception and weight control behavior in Korean adults. Obes Facts 2013; 6(1):17-27. doi: 10.1159/000346805 [Crossref] [ Google Scholar]
- Paeratakul S, White MA, Williamson DA, Ryan DH, Bray GA. Sex, race/ethnicity, socioeconomic status, and BMI in relation to self-perception of overweight. Obes Res 2002; 10(5):345-50. doi: 10.1038/oby.2002.48 [Crossref] [ Google Scholar]
- Atlantis E, Ball K. Association between weight perception and psychological distress. Int J Obes (Lond) 2008; 32(4):715-21. doi: 10.1038/sj.ijo.0803762 [Crossref] [ Google Scholar]
- Xie B, Liu C, Chou CP, Xia J, Spruijt-Metz D, Gong J. Weight perception and psychological factors in Chinese adolescents. J Adolesc Health 2003; 33(3):202-10. doi: 10.1016/s1054-139x(03)00099-5 [Crossref] [ Google Scholar]
- Gillum RF, Sempos CT. Ethnic variation in validity of classification of overweight and obesity using self-reported weight and height in American women and men: the Third National Health and Nutrition Examination Survey. Nutr J 2005; 4:27. doi: 10.1186/1475-2891-4-27 [Crossref] [ Google Scholar]
- Hendley Y, Zhao L, Coverson DL, Din-Dzietham R, Morris A, Quyyumi AA. Differences in weight perception among blacks and whites. J Womens Health (Larchmt) 2011; 20(12):1805-11. doi: 10.1089/jwh.2010.2262 [Crossref] [ Google Scholar]
- Tiggemann M. Body image across the adult life span: stability and change. Body Image 2004; 1(1):29-41. doi: 10.1016/s1740-1445(03)00002-0 [Crossref] [ Google Scholar]
- Quittkat HL, Hartmann AS, Düsing R, Buhlmann U, Vocks S. Body dissatisfaction, importance of appearance, and body appreciation in men and women over the lifespan. Front Psychiatry 2019; 10:864. doi: 10.3389/fpsyt.2019.00864 [Crossref] [ Google Scholar]
- Atkinson RL, Dietz WH, Foreyt JP, Goodwin NJ, Hill JO, Hirsch J. Weight cycling. JAMA 1994; 272(15):1196-202. doi: 10.1001/jama.1994.03520150064038 [Crossref] [ Google Scholar]
- Cereda E, Malavazos AE, Caccialanza R, Rondanelli M, Fatati G, Barichella M. Weight cycling is associated with body weight excess and abdominal fat accumulation: a cross-sectional study. Clin Nutr 2011; 30(6):718-23. doi: 10.1016/j.clnu.2011.06.009 [Crossref] [ Google Scholar]
- Mackie GM, Samocha-Bonet D, Tam CS. Does weight cycling promote obesity and metabolic risk factors?. Obes Res Clin Pract 2017; 11(2):131-9. doi: 10.1016/j.orcp.2016.10.284 [Crossref] [ Google Scholar]
- Simkin-Silverman LR, Wing RR, Plantinga P, Matthews KA, Kuller LH. Lifetime weight cycling and psychological health in normal-weight and overweight women. Int J Eat Disord 1998; 24(2):175-83. doi: 10.1002/(sici)1098-108x(199809)24:2<175::aid-eat7>3.0.co;2-b [Crossref] [ Google Scholar]
- White MA, Masheb RM, Burke-Martindale C, Rothschild B, Grilo CM. Accuracy of self-reported weight among bariatric surgery candidates: the influence of race and weight cycling. Obesity (Silver Spring) 2007; 15(11):2761-8. doi: 10.1038/oby.2007.328 [Crossref] [ Google Scholar]
- Kensinger GJ, Murtaugh MA, Reichmann SK, Tangney CC. Psychological symptoms are greater among weight cycling women with severe binge eating behavior. J Am Diet Assoc 1998; 98(8):863-8. doi: 10.1016/s0002-8223(98)00199-0 [Crossref] [ Google Scholar]
- Strychar I, Lavoie ME, Messier L, Karelis AD, Doucet E, Prud’homme D. Anthropometric, metabolic, psychosocial, and dietary characteristics of overweight/obese postmenopausal women with a history of weight cycling: a MONET (Montreal Ottawa New Emerging Team) study. J Am Diet Assoc 2009; 109(4):718-24. doi: 10.1016/j.jada.2008.12.026 [Crossref] [ Google Scholar]
- Wallner SJ, Luschnigg N, Schnedl WJ, Lahousen T, Sudi K, Crailsheim K. Body fat distribution of overweight females with a history of weight cycling. Int J Obes Relat Metab Disord 2004; 28(9):1143-8. doi: 10.1038/sj.ijo.0802736 [Crossref] [ Google Scholar]
- Mueller WH, Joos SK, Schull WJ. Alternative measurements of obesity: accuracy of body silhouettes and reported weights and heights in a Mexican American sample. Int J Obes 1985; 9(3):193-200. [ Google Scholar]