Arch Iran Med. 25(3):171-177.
doi: 10.34172/aim.2022.29
Original Article
CpG Island Methylation of the Rap1Gap Gene in Medullary Thyroid Cancer
Bita Faam 1  , Ata. A Ghadiri 1, 2, Mohammad Ali Ghaffari 1, Mehdi Totonchi 3, Atieh Amouzegar 4, Fereidoun Azizi 4, Hajiehbibi Shahbazian 5, Mahmoud Hashemitabar 6, Seyed Ahmad Fanaei 7, Layasadat Khorsandi 1, 6, *
Author information:
1Cellular and Molecular Research Center, Medical Basic Sciences Research Institute, Ahvaz Jundishapur University of Medical Sciences, Ahvaz, Iran
2Department of Immunology, School of Medicine, Ahvaz Jundishapur University of Medical Sciences, Ahvaz, Iran
3Department of Endocrinology and Female Infertility, Reproductive Biomedicine Research Center, Royan Institute for Reproductive Biomedicine, ACECR, Tehran, Iran
4Endocrine Research Center, Research Institute for Endocrine Sciences, Shahid Beheshti University of Medical Sciences, Tehran, Iran
5Chronic Disease Care Research Center, School of Nursing and Midwifery, Ahvaz Jundishapur University of Medical Sciences, Ahvaz, Iran.
6Department of Anatomical Sciences, Faculty of Medicine, Ahvaz Jundishapur University of Medical Sciences, Ahvaz, Iran
7Erfan Grand Hospital, Tehran, Iran
*Corresponding Author: Layasadat Khorsandi, PhD; Department of Anatomical Sciences, Faculty of Medicine, Ahvaz Jundishapur University of Medical Sciences, Ahvaz, P.O.Box: 61335, Iran. Tel:+98-613-3336380; Fax:+98-613-3336380; Email:
khorsandi_cmrc@yahoo.com
Abstract
Background:
Medullary thyroid cancer (MTC) is a rare type of neuroendocrine tumor. This study aimed to investigate the gene and protein expression of RAP1GAP and DNA methylation patterns of its CpG74a, CpG74b, and CpG24 in an Iranian population with MTC.
Methods:
In this case-control study, we selected 55 individuals who underwent thyroidectomy in Erfan hospital, Tehran, between 2018 and 2020. Samples were divided into normal thyroid tissues (control; n=20), benign nodule (n=20), and MTC (n=15). DNA methylation patterns were investigated using MSP (methylation-specific PCR). The protein level and mRNA expression of RAP1GAP were also evaluated using western blotting and real-time PCR, respectively.
Results:
The hyper-methylation rates of CpG24 and CpG74a in the MTC samples were considerably higher than the controls (83% versus 15% and 74% versus 17%, respectively; P < 0.001). The methylation/unmethylation ratio of CpG74a, and CpG24 was considerably higher than the controls (P < 0.001). The methylation/unmethylation ratio of CpG24 in the benign nodules was also considerably greater than the controls (P < 0.001). The mRNA expression and the protein level of RAP1GAP in the MTC group were considerably lower than the controls (P = 0.005 and P = 0.035, respectively). In the MTC group, aberrant methylation of CpG74a and CpG24 was significantly correlated with decreasing expression of the Rap1Gap gene (R2 : 0.23; P = 0.032 and R2 : 0.56; P = 0.001, respectively).
Conclusion:
Hyper-methylation in CpG24 and CpG74a and decreasing expression of RAP1GAP can be considered as diagnostic biomarkers for MTC.
Keywords: CpG Island, DNA methylation, Epigenetic, Medullary thyroid cancer, RAP1GAP
Copyright and License Information
© 2022 The Author(s).
This is an open-access article distributed under the terms of the Creative Commons Attribution License (
https://creativecommons.org/licenses/by/4.0), which permits unrestricted use, distribution, and reproduction in any medium, provided the original work is properly cited.
Cite this article as: Faam B, Ghadiri AA, Ghaffari MA, Totonchi M, Amouzegar A, Azizi F, et al. Cpg island methylation of the rap1gap gene in medullary thyroid cancer. Arch Iran Med. 2022;25(3):171-177. doi: 10.34172/aim.2022.29
Introduction
Medullary thyroid cancer (MTC) [OMIM#: 155240] is a neuroendocrine tumor arising from parafollicular C cells, and it is highly resistant to radio- or chemotherapy.1,2 Elevated level of calcitonin is an essential feature of the MTC. Approximately 75% and 25% of MTC patients are sporadic and familial, respectively.3
Recent advances in genetic and molecular pathogenesis have led to finding molecular targets for cancer therapy or diagnosis. Cancer is a genetic alteration that disturbs the normal homeostatic stability between cell death and cell proliferation. In addition to genetic variations, epigenetic variations could be considered as key indicators of carcinogenesis.4 Abnormal increasing DNA methylation, as an important component of epigenetic change, correlates with the progression of malignancies.5,6 Hyper-methylation suppresses the expression of tumor suppressor genes and stimulates cancer progression.7,8
The Rap1Gap gene (OMIM#: 600278) is depleted in various human tumors such as endocrine neoplasia.9 The RAP1GAP gene encodes a type of GTPase-activating-protein (GAP) that modulates the expression of the ras-related protein 1 (RAP1). RAP1GAP is an important tumor suppressor gene that participates in apoptosis, cell migration, and cell-cell adhesion.10 It is down-regulated in multiple cancers such as colorectal, pancreatic, thyroid, and kidney cancers.11 The role of RAP1GAP in human cancers is still unknown, but multiple mechanisms have been identified for the decreased level of RAP1GAP gene expression. DNA hyper-methylation of the RAP1GAP gene can occur in thyroid cancer.12 The expression of Rap1Gap and methylation patterns of CpG24 island and two CpG units within CpG74 (CpG74a, and CpG74b) in MTC tissues were investigated in the current work.
Materials and Methods
Participants
In this case-control study, 55 individuals [12 males (21.8%) and 43 females (78.2%)] were recruited. The thyroid samples were obtained from Erfan hospital, Tehran, between 2018 and 2020. The samples were selected based on outcomes of fine needle aspiration (FNA) examinations of the thyroid nodules. After confirming the diagnosis of nodules using the standard diagnostic criteria, appropriate sections of the thyroid tissues were dissected and were classified into normal, benign, or cancerous tissues. All the samples resected by thyroidectomy were evaluated histologically. The demographic characteristics of each patient were recorded in a questionnaire. The tissue samples were maintained at -80°C until use. All demographic information and thyroid hormone levels were obtained from the patients’ files in the hospital archives.
Methylation-specific PCR (MSP)
The methylation status of CpG24 island and two CpG units within CpG74 (CpG74a, and CpG74b) of the thyroid samples were investigated in this study.It is noticeable that these CpGs are located near the transcription start site. Genomic DNA (gDNA) was extracted from the thyroid samples by a DNA Methylation-Direct kit (Zymo Research Crop, California, USA) according to the kit’s instruction. In brief, 350 ng of gDNA was used in each sodium bisulfate reaction and MSP reactions were performed with a total volume of 15 µL and primers which are summarized in Table 1. The annealing temperatures of PCR amplification were 59°C (CpG74a), 58°C (CpG74b) and 60°C (CpG24) for methylated pair primers and 63°C (CpG74a), 58°C (CpG74b) and 56°C (CpG24) for unmethylated pair primers. The reaction mixture was incubated at 95°C for 2 minutes, followed by 40 cycles of 95°C (50 seconds), annealing temperatures (55 seconds), 75°C (50 seconds), and extension at 72°C (10 minutes). Methylation-specific PCR(MSP) products were analyzed on 2.5% agarose gel.
Table 1.
Used Primers Sequences in the qPCR Amplification and MSP Analysis
|
Target
|
Primer Sequence
|
AT (°C)
|
Product Size (bp)
|
|
GAPDH-mRNA |
F: 5´-CTCATTTCCTGGTATGACAACGA-3´ |
61.1 |
121 |
| R: 5´-CTTCCTCTTGTGCTCTTGCT-3´ |
58.4 |
|
Rap1Gap-mRNA |
F: 5´-ACGAGCATGTCATCAGCAAT-3´ |
56.4 |
138 |
| R: 5´-CCTTCTGGCCAAGAAATTCA-3´ |
56.4 |
| CpG74a, MSP (U) |
F: 5´-TTTTGGGTTTGGTTTTTGGTGTTT-3´ |
55.9 |
113 |
| R: 5´-AACACTCCACAATCATATAACATCCC-3´ |
60.1 |
| CpG74a, MSP (M) |
F: 5´-TTTGGGTTCGGTATTTTGGTGTTC-3´ |
59.3 |
113 |
| R: 5´-ACGCTCCGCGATCATATAACGT-3´ |
60.3 |
| CpG74b, MSP (U) |
F: 5´-TGAGTTTAGTTGTGTTTATTTTTTG-3´ |
53.1 |
122 |
| R: 5´-AAAATATCCAAACTCCCATCAAC-3´ |
55.3 |
| CpG74b, MSP (M) |
F: 5´-CGAGTTTAGTTGCGTTTATTTTTC-3´ |
55.9 |
122 |
| R:5´-ATATCCAAACTCCCGTCGAC-3´ |
57.3 |
| CpG24, MSP (U) |
F: 5´-TAGAGATAAAGTTTAAGAGTTGTGA-3´ |
54.8 |
220 |
| R: 5´-TTCTAAATCAAATAAAAACATCAAA-3´ |
49.9 |
| CpG24, MSP (M) |
F: 5´-TAGAGATAAAGTTTAAGAGTCGCGA-3´ |
58.1 |
220 |
| R: 5´-TTCTAAATCAAATAAAAACGTCGAA-3´ |
53.1 |
M, methylated; U, un-methylated; AT, annealing temperature; bp, base pair.
Quantitative Gene Expression Analysis
Total RNAs were extracted using the TRIzol kit (RiboEx, GeneAll, Seoul, Korea) according to the manufacturer’s guides. The isolated RNAs were converted to cDNA using a cDNA synthesis kit (Takara Bio Inc, Shiga, Japan). The generated cDNA (2 μL) was amplified in a PCR reaction mix (25 μL) containing 12.5 μL SYBR Green Master Mix (Takara Bio Inc, Shiga, Japan), and 0.2 μL of each primer (Table 2). The following program was applied to polymerase chain reaction (PCR) amplification (40 cycles): 95ºC for 30 seconds, 95ºC for 15 seconds, and 60ºC for 20 seconds. The quantity of PCR product generated from amplification of the RAP1GAP gene was standardized using the quantity of glyceraldehyde 3- phosphate dehydrogenase (GAPDH) product for each sample to obtain a relative level of gene expression. Data were analyzed using the 2 -ΔΔCT method.
Table 2.
Demographics and Thyroid Hormones Levels of Participants by Group
|
Variables
|
Control (n=20)
|
Benign (n=20)
|
MTC (n=15)
|
| Age (years) |
48.7 ± 10.5 |
50.5 ± 11.1 P = 0.121 |
38.8 ± 12.5 P = 0.048* |
| Gender (females) (%) |
17 (85) |
14 (70) P = 0.087 |
12 (80) P = 0.046* |
| BMI (kg/m2) |
21.6 ± 4.5 |
31.9 ± 5.7 P = 0.203 |
28.1 ± 5.1 P = 0.172 |
| Tumor size (cm) |
1.5 ± 0.24 |
1.7 ± 0.28 P = 0.293 |
1.8 ± 0.43 P = 0.385 |
| T3 (ng/dL) |
98.4 ± 8.7 |
106.6 ± 11.5 P = 0.932 |
118.7 ± 10.2 P = 0.085 |
| T4 (µg/dL) |
8.3 ± 1.9 |
13.7 ± 2.8 P = 0.071 |
11.4 ± 2.3 P = 0.084 |
| TSH (IU/L) |
1.7 ± 0.19 |
2.1 ± 0.23 P = 0.124 |
2.6 ± 0.31 P = 0.217 |
| Calcitonin (pg/mL) |
24.4 ± 3.9 |
33.5 ± 4.6 P = 0.064 |
158.7 ± 12.3 P = 0.007* |
| SBP (mm Hg) |
116 ± 11.6 |
124 ± 12.9 P = 0.341 |
118 ± 13.4 P = 0.464 |
| DBP |
76 ± 6.7 |
75 ± 7.2 P = 0.459 |
78 ± 6.9 P = 0.512 |
MTC, medullary thyroid cancer; BMI, body mass index; SBP, systolic blood pressure; DBP, diastolic blood pressure.
*
P < 0.05. The quantitative variables were compared between different groups of thyroid tissues with one-way analysis of variance (ANOVA).
Western Blotting Analysis
The tissue samples were washed and added to radioimmunoprecipitation (RIPA) lysis buffer with protease inhibitor. The BCA assay kit (Thermo Fisher Scientific, Waltham, USA) was used to obtain protein from the cells. Lysate protein was separated on SDS-PAGE (10%) and transferred onto a PVDF membrane (Sigma, St. Louis, MO, USA). The diluted primary antibodies (Anti-RAP1GAP, ab32119; Anti-GAPDH, ab128915; Abcam, USA) were incubated for 2 hours at room temperature. Then the cells were exposed to horseradish peroxidase-conjugated secondary antibody (ab6721, Abcam, USA) for 90 minutes at room temperature. An ECL detection kit (Sigma, St. Louis, MO, USA) was used to visualize the specific proteins. Finally, we used the ImageJ software (Version 6, Bethesda, MD) to quantitate the band density.
Statistical Analysis
The normality of distribution was checked for all variables by Kolmogorov-Smirnov analysis. Normally distributed continuous variables are reported as mean ± SD, whereas categorical variables were summarized as frequencies and percentages. The chi-square test was applied to examine the frequencies of methylation. Quantitative variables were compared with one-way analysis of variance (ANOVA) and Tukey’s post hoc test. To determine the correlation of the RAP1GAP gene and protein expression with DNA methylation, bivariate linear correlation analysis was done. Multinomial logistic regression was used to control the effects of potential confounders. All analyses were done using the SPSS software, version 20 (SPSS, Inc. Chicago, IL, USA). P values < 0.05 were considered as statistically significant.
Results
Demographic and Clinical Pathologic Data of Participants
The demographic data for each group was as follows: the control group (3 males; 17 females): 48.7 ± 10.5 years old; the benign group (6 males; 14 females): 50.5 ± 11.1 years old; and the MTC group (3 males; 12 females): 38.8 ± 12.5 years old. There was a significant difference in age distribution across these groups (P = 0.043) (Table 2). In the MTC group, 10 cases (66.6%) had the sporadic form. The mean tumor size of MTC was 1.8 ± 0.43 cm. Metastasis was not observed in the MTC group in this study.
Methylation Patterns
The hyper-methylation pattern of selected CpGs was only seen in the sporadic form of MTC. The hyper-methylation of CpG24 in patients with MTC or benign nodules was considerably greater than the control individuals (83% versus 15% and 74% versus 15%, respectively; P < 0.001). There was no considerable change in the hyper-methylation rate of CpG24 between the MTC and benign nodules groups. The hyper-methylation rate of the CpG74a in MTC was considerably higher than the normal tissue (74% versus 17%, P < 0.001) and benign nodules (74% versus 35%, P = 0.036). The hyper-methylation rate of CpG74b in the MTC group was not significantly higher than the controls (48% versus 36%; P = 0.062) and benign nodules (48% versus 49%; P = 0.175) (Table 3 and Figure 1).
Table 3.
Methylation Status of CpG24, CpG74a and CpG74b in Different Groups of Thyroid Tissues
|
Groups
|
CpG24
|
CpG74
a
|
CpG74
b
|
| Contro1 |
M
M/U |
3 (15%)
0.17 |
4 (17%)
0.20 |
7 (365)
0.56 |
| Benign |
M
M/U |
15 (75%), P < 001
3.00, P < 001 |
7 (35%), P = 0.053
0.53, P = 0.056 |
10 (49%), P = 0.092
0.96, P = 0.102 |
| MTC |
M
M/U |
12 (83%), P < 001
4.9, P < 001 |
11 (74%), P < 0.001
2.8, P < 0.001 |
7 (48%), P = 0.062
0.92, P = 0.431 |
M, Methylated; U, Un-methylated.
Chi-square test was applied to examine the methylation status in different groups.
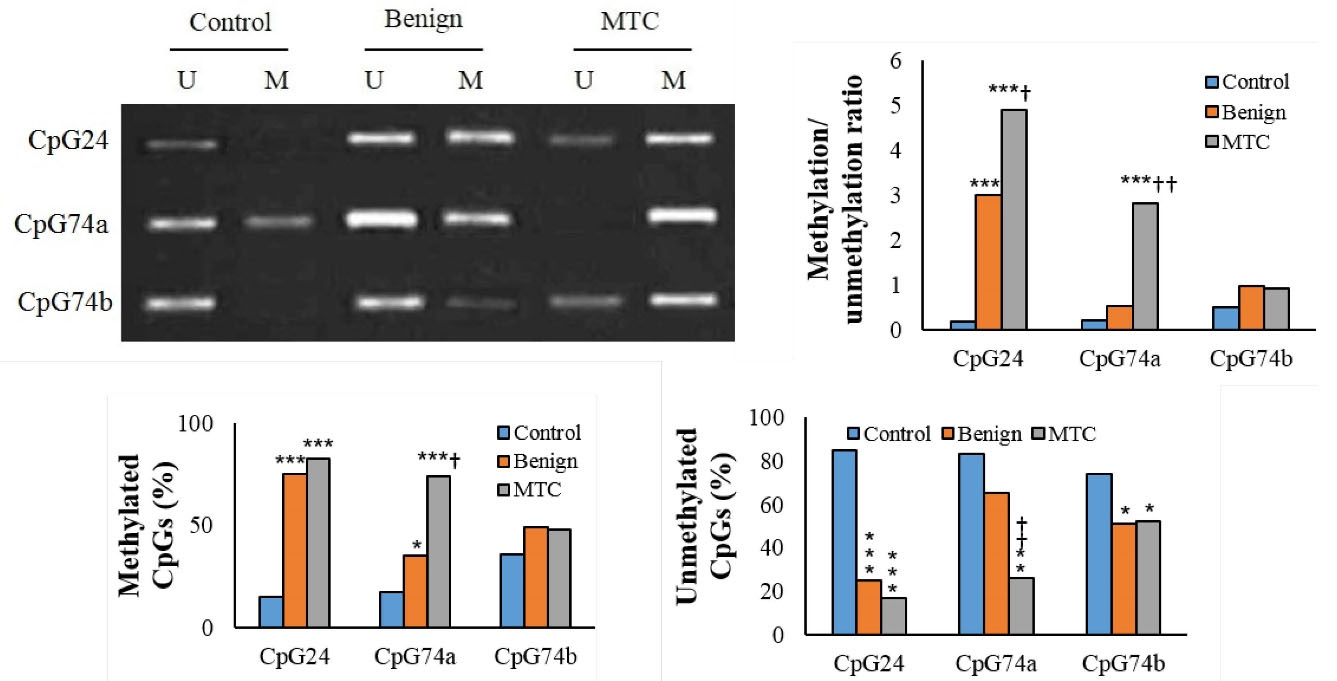
Figure 1.
CpGs Methylation Pattern in Different Groups (M: Methylated; U: Un-methylated). *P < 0.05, **P < 0.01, ***P < 0.001, †P < 0.05, ††P < 0.01, †††P < 0.001. †and * indicate comparison to benign nodules and normal thyroid tissue (control), respectively.
.
CpGs Methylation Pattern in Different Groups (M: Methylated; U: Un-methylated). *P < 0.05, **P < 0.01, ***P < 0.001, †P < 0.05, ††P < 0.01, †††P < 0.001. †and * indicate comparison to benign nodules and normal thyroid tissue (control), respectively.
The methylation/unmethylation ratio of CpG24 in patients with MTC was considerably greater than the benign nodules or normal tissue (P < 001). There was a considerable elevation in the methylation/unmethylation ratio of CpG24 in the benign nodules in comparison to the controls (P < 001). The methylation/unmethylation ratio of CpG74a in MTC was considerably higher than the controls and benign nodule groups (P < 001). The methylation/unmethylation ratio of CpG74b in MTC was not considerably greater than the normal tissue (P = 0.431). The methylation/unmethylation ratio of the CpG74a and CpG74b in benign nodules was not significantly different from the controls (Figure 1 and Table 3).
We also evaluated the methylation status of these CpGs simultaneously. Accordingly, all three CpGs were considerably hyper-methylated in patients with MTC compared to the normal thyroid tissues (31% versus 4%; P < 0.001). The hyper-methylation of two CpGs in the MTC group was considerably higher than the normal thyroid (69% versus 30%, P < 0.008) and benign nodules (69% versus 41%, P = 0.032). The hyper-methylation of only one CpG in MTC was noticeably lower than the normal group (9% versus 52%, P < 0.001). Unmethylated patterns for all three CpGs were not seen in the MTC group (P < 0.001). The unmethylated pattern in the benign nodules was considerably lower than the normal thyroid samples (4.8% versus 16%, P = 0.016). The majority of patients with MTC had a hyper-methylated pattern in two CpGs (Table 4 and Figure 2).
Table 4.
Simultaneously Hyper-methylation Frequencies of CpGs in Different Groups
|
Groups
|
3 CpGs
|
2 CpGs
|
1 CpG
|
0 CpG
|
| Control |
1 (4%) |
6 (30%) |
11 (52%) |
3 (16%) |
| Benign |
5 (22%)
P < 001 |
8 (41%)
P = 052 |
7 (32%)
P = 0.049 |
1 (4.8%)
P = 016 |
| MTC |
5 (31%)
P < 001 |
10 (69%)
P = 008 |
2 (9%)
P < 001 |
0 (0%)
P < 001 |
MTC, medullary thyroid cancer.
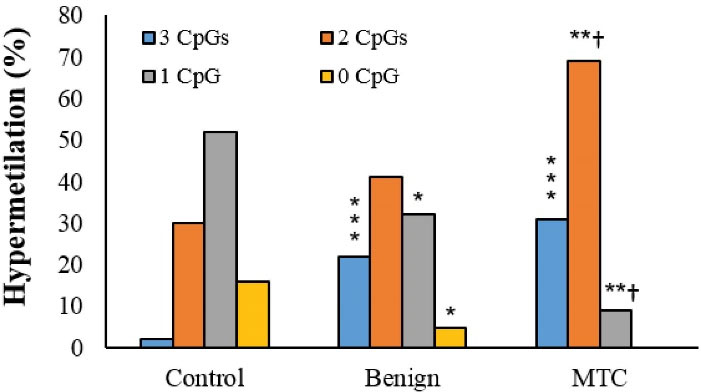
Figure 2.
Simultaneous Hyper-methylation Frequencies of CpGs in Different Groups. *P < 0.05, **P < 0.01, ***P < 0.001, †P < 0.05 and* indicate comparison to benign nodules and normal thyroid tissue (control), respectively.
.
Simultaneous Hyper-methylation Frequencies of CpGs in Different Groups. *P < 0.05, **P < 0.01, ***P < 0.001, †P < 0.05 and* indicate comparison to benign nodules and normal thyroid tissue (control), respectively.
To assess the role of demographic and hormonal variables in the hyper-methylation status of selected CpGs, we performed five multinomial logistic regression models (Table 5).
Table 5.
The Association of Methylation Status in Three CpGs with MTC
|
Models
|
CpG24
|
CpG74
a
|
CpG74
b
|
| Model I |
1.23 (0.21?1.85)
P = 0.045 |
1.34 (0.23?1.52)
P = 0.046 |
1.04 (0.15?1.12)
P = 0.189 |
| Moodle II |
1.65(0.75? 2.11)
P = 0.022 |
1.45 (0.32?1.25)
P = 0.035 |
1.15 (0.22? 2.1)
P = 0.074 |
| Model III |
1.28(0.15?1.42)
P = 0.058 |
1.40 (0.37?1.25)
P = 0.083 |
1.24 (0.19?2.89)
P = 0.077 |
| Model IV |
1.44(0.73?2.13)
P = 0.063 |
1.66 (0.52?1.83)
P = 0.021 |
1.31 (0.84?2.28)
P = 0.58 |
| Model V |
1.48(0.26?2.20)
P = 0.088 |
1.92 (0.67?2.31)
P < 0.001 |
1.58 (0.25?4.81)
P = 0.032 |
Model I, crude model; Model II, adjusted for sex and age; Model III, adjusted for sex, age and BMI; Model IV, adjusted for sex, age, T4 and TSH; Model V, adjusted for sex, age, calcitonin.
Control group was considered as reference in regression models. Multinomial logistic regression analysis was used to examine the effects of potential confounders.
The hyper-methylation rate of CpG24 was associated with MTC (odds ratio [OR]: 1.23; 95% confidence interval [CI]: 0.21–1.85; P = 0.045). This association remained significant after adjustment for sex and age (OR: 1.65; 95% CI: 0.75–2.11; P = 0.022). Patients with MTC had a higher risk of hyper-methylation in the CpG74a (OR: 1.34; 95% CI: 0.23–1.52; P = 0.046). This association was also significant after adjustment for sex and age (OR: 1.45; 95% CI: 0.32–1.25; P = 0.035). There was not any association between CpG74b hyper-methylation and MTC after adjustment for sex and age.
The association between MTC and hyper-methylation of CpG74a was also significant after adjustment for confounding variables such as sex, age, and calcitonin level (model V) (OR: 1.92; 95% CI: 0.67–2.31; P < 0.001). The risk of aberrant DNA hyper-methylation of CpG74b in the MTC group was only seen after adjustment for confounders in model V (OR: 1.58; 95% CI: 0.25–4.81; P = 0.032). Information about the other models is available in Table 5.
RAP1GAP
Gene Expression
The expression of the RAP1GAP gene in MTC tissue samples was 3.2-folds lower than the controls (0.31 ± 0.08 versus 1 ± 0.00, P = 0.005). Benign nodules showed no noticeable change in the expression of the RAP1GAP gene compared to the normal thyroid tissue (P = 0.069).The expression of Rap1Gap in the MTC samples was 2.9-folds lower than the benign nodules (0.31 ± 0.08 versus 0.9 ± 0.12, P = 0.041) (Figure 3).
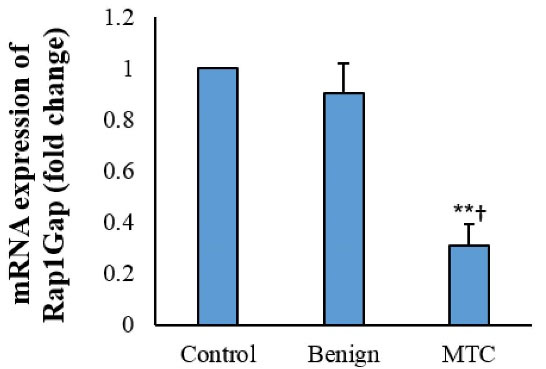
Figure 3.
Rap1Gap mRNA Expression in Thyroid Tissues (Fold Change). Each assay was replicated 3 times, and presented as mean ± SD. **P < 0.01, †P < 0.05.
.
Rap1Gap mRNA Expression in Thyroid Tissues (Fold Change). Each assay was replicated 3 times, and presented as mean ± SD. **P < 0.01, †P < 0.05.
In the MTC group, the increasing aberrant methylation of CpG74a correlated with decreasing expression of the Rap1Gap gene (R2: 0.23; P = 0.032), while this correlation was not observed in the controls and benign nodule groups. The decreasing expression of the RAP1GAP gene was correlated with increasing aberrant methylation of the CpG24 in the MTC and benign groups (R2: 0.56, P = 0.001 and R2: 0.31, P = 0.029, respectively). The hyper-methylation of CpG74b was not correlated with expression of the RAP1GAP gene (P = 0.234).
Western Blotting Analysis
The western blotting results showed a low protein level of RAP1GAP in tissues from MTC patients compared to the control (0.85 ± 0.15 versus 3.7 ± 0.38; P = 0.017). Benign nodules showed no obvious change in the expression of the RAP1GAP protein compared to the normal thyroid tissue (2.8 ± 0.31 versus 3.7 ± 0.38; P = 0.072). The expression of the RAP1GAP protein in the MTC samples was considerably lower than the benign nodules (3.7 ± 0.38 versus 2.8 ± 0.31; P = 0.018) (Figure 4).
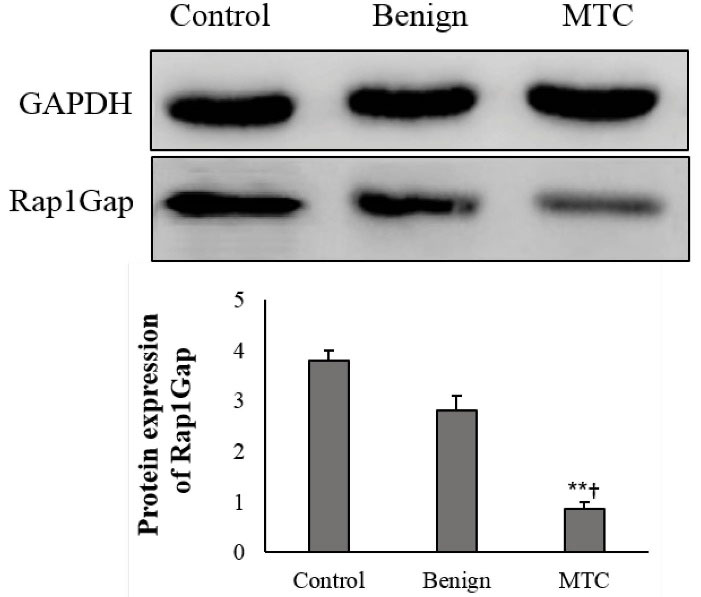
Figure 4.
Expression of RAP1GAP Protein in Tissue Samples and Cells. The ImageJ software was used to quantify protein expression. The data were normalized to GAPDH band intensity. Each assay was done 5 times, and mean ± SD is presented. **P < 0.01, †P < 0.05.
.
Expression of RAP1GAP Protein in Tissue Samples and Cells. The ImageJ software was used to quantify protein expression. The data were normalized to GAPDH band intensity. Each assay was done 5 times, and mean ± SD is presented. **P < 0.01, †P < 0.05.
Assessing the correlation of the RAP1GAP protein expression with the DNA methylation pattern of CpG74a demonstrated that reduced expression of the RAP1GAP protein was considerably correlated with hyper-methylation in the MTC group (R2: 0.28; P = 0.045). However, this correlation was not seen in the benign and control groups. Expression of the RAP1GAP protein was also correlated with hyper-methylation rate of CpG24 in the benign nodules and MTC group (R2: 0.36, P = 0.001 and R2: 0.31, P = 0.019, respectively). The hyper-methylation rate of CpG74b was not correlated with the RAP1GAP protein expression (P = 0.116).
Discussion
This study showed that the expression of RAP1GAP as a suppressor gene in MTC patients was considerably lower than the normal individuals. Previous studies have also reported similar results for various tumor suppressor genes.13-15 Down-regulation of the Rap1Gap gene can be due to hyper-methylation of its regulatory region.12 It has been reported that downregulation ofRAP1GAPby promoter hyper-methylation promotes melanoma cell metastasis.16
To examine the relation of hyper-methylation to RAP1GAP gene expression, we evaluated the hyper-methylation pattern of three CpGs. Accordingly, all three CpGs were hyper-methylated in 31%, 22%, and 2% of tissues from patients with MTC, benign nodules, and normal thyroid groups, respectively. The hyper-methylation of two CpGs occurred in 69%, 41%, and 30% of tissues from patients with MTC, benign nodules, and normal thyroid. The hyper-methylation of only one CpG was seen in 9% of tissues from MTC, 32% of benign nodules, and 52% of the control group. Interestingly, the unmethylated pattern for all three CpGs was not observed in MTC tissues, indicating the methylation of CpGs to be associated with malignancy.
The methylation/unmethylation ratios of the CpG74a and CpG24 were considerably high in the MTC patients. However, the methylation/unmethylation ratio of CpG24 was also high in the benign nodules. On the other hand, the methylation/unmethylation ratio of CpG74b was not significantly greater than the controls. Therefore, CpG74a can be considered as a specific epigenetic marker for clinical prognosis of MTC.
To determine the association of aberrant regulatory region methylation with expression of RAP1GAP, we compared the methylation status with the RAP1GAP expression data in MTC and normal thyroid tissues. In this regard, the decreasing mRNA expression and protein level of the RAP1GAP in the MTC patients were associated with the increasing methylation rate of the CpG74a and CpG24.
The result of this study showed that in the MTC group, the hyper-methylation of CpG74a was 92% higher than the normal thyroid group after adjustment for calcitonin. Calcitonin is an important MTC marker for prognosis, diagnosis, surgical planning, and follow-up.17,18 It has been demonstrated that serum levels of calcitonin correlate with tumor size and lymph node metastasis.18 A serum calcitonin level higher than 500 pg/mL was associated with lymph node metastasis.17 In line with these reports, in our study, the average calcitonin level of the MTC patients was 158 pg/mL. Interestingly, metastasis was not reported in the MTC group in this study.
There are limited studies that determine the importance of epigenetic variations, especially DNA methylation in the MTC. Ceolin et alindicated that global DNA methylation levels were higher in MTC compared to papillary thyroid cancer patients.2 The role of epigenetics in MTC is largely defined as hyper-methylation of CpG sites in the promoter region of Ras-association domain family member 1A (RASSF1A) and telomerase reverse transcriptase (TERT) genes.19
In a large cohort study, Wang and colleagues reported that TERT gene hyper-methylation is related to high DNA copy numbers, and MTC patients with higher TERT methylation have lower chances of survival.20
The results of a study in 2002 showed that TERT is aberrantly methylated in sporadic MTC. Additionally, it was found that increased methylation index was correlated with TERT gene expression.21 The hyper-methylation of CpG islands in the promoter region of RASSF1A have been reported in the MTC patients.20-22
Macia et al in 2012, showed that Sporouty1 promoter is frequently hyper-methylated in MTC.14 CpG sites methylation of tumor-related promoters including SLC5A8, RASSF1, and MGMT occurs in undifferentiated thyroid carcinoma. Also, SLC5A8 was the most noticeable hyper-methylated gene in thyroid cancers in a meta-analysis.19 In a study by Schagdarsurengin et al, RASSF10 was hyper-methylated in 100% of MTC patients.23 Conversely, CpG island methylation of PTEN, MGMT, p16, and TSHR genes have not shown any considerable hyper-methylation in the MTC individuals.24-26
Thyroid hormone synthesis-related genes are also epigenetically down-regulated during thyroid cancer promotion. The promoter region of the TSH-R gene was methylated in 25% of the thyroid cancer patients.27
Various tumor-suppressor genes and thyroid hormone-related genes are epigenetically silenced in thyroid tumors.28-30 Epigenetic silencing has been highlighted in thyroid cancer progression. The promoter of the TSH receptor, pendrin, and NIS have been silenced in thyroid carcinomas.31,32
In conclusion, this study identifies RAP1GAPas a candidate tumor-suppressor gene in MTC. Hyper-methylation in the regulatory region of the RAP1GAP gene may contribute to MTC pathogenesis and this status could be a new potential diagnostic biomarker.
Authors’ Contribution
LK: supervised the study, data statistical analysis and critical reviewing of manuscript. BF: performed sampling, collection of data, experiments and data analysis. AAG: get the idea, supervised and data curation. MAG: designing the study, searching the literatures and, manuscript preparation. MT: performing clinical section and data acquisition. AA: definition of intellectual content and design the study. FA: made total concept, designing the study. HBJ: definition of intellectual content and design the study. AF: performing clinical section, data acquisition. MH: searching the literatures and manuscript editing.
Conflict of Interest Disclosures
The authors declare that they have no conflict of interest.
Ethical Statement
This study was approved by the Ethics Committee of Ahvaz Jundishapur University of Medical Sciences (No: Ajums.Rec.1393.151) and informed consent was provided by all participants included in the study.
Funding
This work has been supported by the Ahvaz Jundishapur University of Medical Sciences, Ahvaz, Iran (code: CMRC 122), and it is a part of Ph. D thesis of Bita Faam.
References
- Wang X, Li C, Huang L, Shui CY, Liu W, Cai YC. [Progression of diagnosis and treatment of medullary thyroid carcinoma]. Zhonghua Er Bi Yan Hou Tou Jing Wai Ke Za Zhi 2019; 54(4):306-10. doi: 10.3760/cma.j.issn.1673-0860.2019.04.015 [Crossref] [ Google Scholar]
- Ceolin L, Goularte APP, Ferreira CV, Romitti M, Maia AL. Global DNA methylation profile in medullary thyroid cancer patients. Exp Mol Pathol 2018; 105(1):110-4. doi: 10.1016/j.yexmp.2018.06.003 [Crossref] [ Google Scholar]
- Larouche V, Akirov A, Thomas CM, Krzyzanowska MK, Ezzat S. A primer on the genetics of medullary thyroid cancer. Curr Oncol 2019; 26(6):389-94. doi: 10.3747/co.26.5553 [Crossref] [ Google Scholar]
- Khatami F, Larijani B, Heshmat R, Nasiri S, Saffar H, Shafiee G. Promoter methylation of four tumor suppressor genes in human papillary thyroid carcinoma. Iran J Pathol 2019; 14(4):290-8. doi: 10.30699/ijp.2019.94401.1922 [Crossref] [ Google Scholar]
- Belinsky SA. Gene-promoter hypermethylation as a biomarker in lung cancer. Nat Rev Cancer 2004; 4(9):707-17. doi: 10.1038/nrc1432 [Crossref] [ Google Scholar]
- Costa FF. Epigenomics in cancer management. Cancer Manag Res 2010; 2:255-65. doi: 10.2147/cmr.s7280 [Crossref] [ Google Scholar]
- Baylin SB. DNA methylation and gene silencing in cancer. Nat Clin Pract Oncol 2005; 2 Suppl 1:S4-11. doi: 10.1038/ncponc0354 [Crossref] [ Google Scholar]
- Husni RE, Shiba-Ishii A, Nakagawa T, Dai T, Kim Y, Hong J. DNA hypomethylation-related overexpression of SFN, GORASP2 and ZYG11A is a novel prognostic biomarker for early stage lung adenocarcinoma. Oncotarget 2019; 10(17):1625-36. doi: 10.18632/oncotarget.26676 [Crossref] [ Google Scholar]
- Tsygankova OM, Prendergast GV, Puttaswamy K, Wang Y, Feldman MD, Wang H. Downregulation of Rap1GAP contributes to Ras transformation. Mol Cell Biol 2007; 27(19):6647-58. doi: 10.1128/mcb.00155-07 [Crossref] [ Google Scholar]
- Zhang YL, Wang RC, Cheng K, Ring BZ, Su L. Roles of Rap1 signaling in tumor cell migration and invasion. Cancer Biol Med 2017; 14(1):90-9. doi: 10.20892/j.issn.2095-3941.2016.0086 [Crossref] [ Google Scholar]
- Kim WJ, Gersey Z, Daaka Y. Rap1GAP regulates renal cell carcinoma invasion. Cancer Lett 2012; 320(1):65-71. doi: 10.1016/j.canlet.2012.01.022 [Crossref] [ Google Scholar]
- Zuo H, Gandhi M, Edreira MM, Hochbaum D, Nimgaonkar VL, Zhang P. Downregulation of Rap1GAP through epigenetic silencing and loss of heterozygosity promotes invasion and progression of thyroid tumors. Cancer Res 2010; 70(4):1389-97. doi: 10.1158/0008-5472.can-09-2812 [Crossref] [ Google Scholar]
- Shakiba E, Movahedi M, Majd A, Hedayati M. Investigating the expression and promoter methylation of RET gene in patients with medullary thyroid cancer with unmutated RET. J Cell Physiol 2019. doi: 10.1002/jcp.28295 [Crossref]
- Macià A, Gallel P, Vaquero M, Gou-Fabregas M, Santacana M, Maliszewska A. Sprouty1 is a candidate tumor-suppressor gene in medullary thyroid carcinoma. Oncogene 2012; 31(35):3961-72. doi: 10.1038/onc.2011.556 [Crossref] [ Google Scholar]
- Singh N, Rashid S, Rashid S, Dash NR, Gupta S, Saraya A. Clinical significance of promoter methylation status of tumor suppressor genes in circulating DNA of pancreatic cancer patients. J Cancer Res Clin Oncol 2020; 146(4):897-907. doi: 10.1007/s00432-020-03169-y [Crossref] [ Google Scholar]
- Zheng H, Gao L, Feng Y, Yuan L, Zhao H, Cornelius LA. Down-regulation of Rap1GAP via promoter hypermethylation promotes melanoma cell proliferation, survival, and migration. Cancer Res 2009; 69(2):449-57. doi: 10.1158/0008-5472.can-08-2399 [Crossref] [ Google Scholar]
- Opsahl EM, Akslen LA, Schlichting E, Aas T, Brauckhoff K, Hagen AI. The role of calcitonin in predicting the extent of surgery in medullary thyroid carcinoma: a nationwide population-based study in Norway. Eur Thyroid J 2019; 8(3):159-66. doi: 10.1159/000499018 [Crossref] [ Google Scholar]
- Ceolin L, Duval M, Benini AF, Ferreira CV, Maia AL. Medullary thyroid carcinoma beyond surgery: advances, challenges, and perspectives. Endocr Relat Cancer 2019; 26(9):R499-R518. doi: 10.1530/erc-18-0574 [Crossref] [ Google Scholar]
- Khatami F, Larijani B, Heshmat R, Keshtkar A, Mohammadamoli M, Teimoori-Toolabi L. Meta-analysis of promoter methylation in eight tumor-suppressor genes and its association with the risk of thyroid cancer. PLoS One 2017; 12(9):e0184892. doi: 10.1371/journal.pone.0184892 [Crossref] [ Google Scholar]
- Wang N, Kjellin H, Sofiadis A, Fotouhi O, Juhlin CC, Bäckdahl M. Genetic and epigenetic background and protein expression profiles in relation to telomerase activation in medullary thyroid carcinoma. Oncotarget 2016; 7(16):21332-46. doi: 10.18632/oncotarget.7237 [Crossref] [ Google Scholar]
- Schagdarsurengin U, Gimm O, Hoang-Vu C, Dralle H, Pfeifer GP, Dammann R. Frequent epigenetic silencing of the CpG island promoter of RASSF1A in thyroid carcinoma. Cancer Res 2002; 62(13):3698-701. [ Google Scholar]
- Mohammadi-Asl J, Larijani B, Khorgami Z, Tavangar SM, Haghpanah V, Kheirollahi M. Qualitative and quantitative promoter hypermethylation patterns of the P16, TSHR, RASSF1A and RARβ2 genes in papillary thyroid carcinoma. Med Oncol 2011; 28(4):1123-8. doi: 10.1007/s12032-010-9587-z [Crossref] [ Google Scholar]
- Schagdarsurengin U, Richter AM, Wöhler C, Dammann RH. Frequent epigenetic inactivation of RASSF10 in thyroid cancer. Epigenetics 2009; 4(8):571-6. doi: 10.4161/epi.4.8.10056 [Crossref] [ Google Scholar]
- Khatami F, Tavangar SM. Genetic and epigenetic of medullary thyroid cancer. Iran Biomed J 2018; 22(3):142-50. doi: 10.22034/ibj.22.3.142 [Crossref] [ Google Scholar]
- Schagdarsurengin U, Gimm O, Dralle H, Hoang-Vu C, Dammann R. CpG island methylation of tumor-related promoters occurs preferentially in undifferentiated carcinoma. Thyroid 2006; 16(7):633-42. doi: 10.1089/thy.2006.16.633 [Crossref] [ Google Scholar]
- Sarmadi S, Izadi-Mood N, Sotoudeh K, Tavangar SM. Altered PTEN expression; a diagnostic marker for differentiating normal, hyperplastic and neoplastic endometrium. Diagn Pathol 2009; 4:41. doi: 10.1186/1746-1596-4-41 [Crossref] [ Google Scholar]
- Khan MS, Pandith AA, Masoodi SR, Wani KA, Ul Hussain M, Mudassar S. Epigenetic silencing of TSHR gene in thyroid cancer patients in relation to their BRAF V600E mutation status. Endocrine 2014; 47(2):449-55. doi: 10.1007/s12020-014-0319-6 [Crossref] [ Google Scholar]
- Kondo T, Nakazawa T, Ma D, Niu D, Mochizuki K, Kawasaki T. Epigenetic silencing of TTF-1/NKX2-1 through DNA hypermethylation and histone H3 modulation in thyroid carcinomas. Lab Invest 2009; 89(7):791-9. doi: 10.1038/labinvest.2009.50 [Crossref] [ Google Scholar]
- Xing M. Gene methylation in thyroid tumorigenesis. Endocrinology 2007; 148(3):948-53. doi: 10.1210/en.2006-0927 [Crossref] [ Google Scholar]
- Kondo T, Asa SL, Ezzat S. Epigenetic dysregulation in thyroid neoplasia. Endocrinol Metab Clin North Am 2008; 37(2):389-400. doi: 10.1016/j.ecl.2007.12.002 [Crossref] [ Google Scholar]
- Neumann S, Schuchardt K, Reske A, Reske A, Emmrich P, Paschke R. Lack of correlation for sodium iodide symporter mRNA and protein expression and analysis of sodium iodide symporter promoter methylation in benign cold thyroid nodules. Thyroid 2004; 14(2):99-111. doi: 10.1089/105072504322880337 [Crossref] [ Google Scholar]
- Xing M, Usadel H, Cohen Y, Tokumaru Y, Guo Z, Westra WB. Methylation of the thyroid-stimulating hormone receptor gene in epithelial thyroid tumors: a marker of malignancy and a cause of gene silencing. Cancer Res 2003; 63(9):2316-21. [ Google Scholar]