Arch Iran Med. 25(2):118-123.
doi: 10.34172/aim.2022.19
Original Article
Abdominal Ultrasound Combined with Laboratory Tests as a Reliable, Easily Accessible and Cost-Effective Way of Assessing the Stages of Liver Fibrosis and Cirrhosis
Ghodratolllah Montazeri 1, N. Rohban 1, Masoud Sotoudeh 1, Sadegh Massarrat 1, *
Author information:
1Digestive Disease Research Institute, Shariati Hospital, Tehran University of Medical Sciences, Tehran, Iran
*Corresponding Author: Prof. Sadegh Massarrat, Digestive Disease Research Institute, Shariati Hospital, Kargar Shoali Avenue, Postal code 14117-13135. Tel: +982182415000, Fax: +982182415400, Email:
smassarrat@yahoo.com
Abstract
Background:
In the last two decades, the simple low-cost abdominal ultrasound (US) examination for the diagnosis of advanced fibrosis and cirrhosis was displaced by very expensive and not readily available modern imaging systems like magnetic resonance imaging (MRI), computed tomography (CT) scan and transient elastography. The aim of this study is to evaluate and emphasize the potential of US for diagnosis of advanced liver fibrosis and cirrhosis.
Methods:
US, laboratory tests (blood counts, transaminases, aspartate platelet ratio index [APRI], international normalized ratio [INR], serum albumin and bilirubin) and liver biopsy were performed on 197 patients with chronic liver diseases. Development of liver fibrosis was categorized in six stages, with stages 1–3 considered as mild to moderate and stages 4–6 as advanced fibrosis. Sonographic parameters (interrupted liver surface line, nodularity of liver surface, biconvexity of liver edges, grade of liver angle, caudate lobe diameter, parenchyma echotexture and spleen size) were obtained. All variables were dichotomized into zero and one and compared with respect to the different stages of liver fibrosis. The sensitivity, specificity, and positive and negative predictive values of all variables as well as their summations scores through receiver operating characteristic (ROC) curve analysis were calculated for the correct histologic diagnosis.
Results:
Totally, 39 cases had severe fibrosis and cirrhosis and 158 had mild to moderate fibrosis. The area under the curve by ROC curve analysis of sonographic variables (surface nodularity, angle of left lobe, echotexture of liver and spleen size) was 85%, that of laboratory data (APRI, serum albumin and INR combined) was 83.8%, that of APRI alone was 81.8% and all combined (sonography and lab data together) was 92.4% for the correct diagnosis.
Conclusion:
The simple US examination, alone or combined with lab data, is able to diagnose advanced fibrosis and cirrhosis with excellent accuracy, making the use of other modern imaging modalities unnecessary.
Keywords: Liver fibrosis, Ultrasound
Copyright and License Information
© 2022 The Author(s).
This is an open-access article distributed under the terms of the Creative Commons Attribution License (
https://creativecommons.org/licenses/by/4.0), which permits unrestricted use, distribution, and reproduction in any medium, provided the original work is properly cited.
Cite this article as: Montazeri G, Rohban N, Sotoudeh M, Massarrat S. Abdominal ultrasound combined with laboratory tests as a reliable, easily accessible and cost-effective way of assessing the stages of liver fibrosis and cirrhosis. Arch Iran Med. 2022; 25(2):118-123. doi: 10.34172/aim.2022.19
Introduction
Assessing the progression of chronic liver diseases and the stages of fibrosis is very important for the prognosis, the effectiveness of therapy and its outcome. The gold standard for the diagnosis of the stages of fibrosis is based on histological findings in biopsy specimens. However, in the last two decades, the risk of complications due to taking a liver biopsy led to the introduction of non-invasive techniques based on very different imaging modalities like abdominal ultrasound, computed tomography (CT) scan, magnetic resonance imaging (MRI), transient elastography (TE, Fibroscan) and their modifications as well as their combinations with serum markers.
Studies with CT or MRI alone are very few; in a Chinese study, CT imaging was able to diagnose liver cirrhosis with a specificity of 100% and sensitivity of 48.5%.1 Through MRI alone, surface nodularity and parenchyma echotexture had the best accuracies of 80.3 and 81.6%, respectively, for histological detection of significant fibrosis.2 CT scan and MRI combined showed good correlation of liver surface irregularity and spleen diameter with grade of liver fibrosis.3 In a further study, liver surface nodularity was assessed by CT and MRI in 27 patients including 7 with cirrhosis.4 Surface nodularity score was different between patients with and without liver cirrhosis, but not identical between CT and MRI.
TE, however, has become the most favorable method for the detection and evaluation of liver fibrosis in the last two decades.5-8 Fibroscan displaced all other methods. It replaced not only the use of invasive liver biopsy as a routine method, but also sidelined the abdominal ultrasound (US) examination.9 With this method, liver stiffness is measured in a small area under the surface of the liver given as a Pascal index. The method is inaccurate in obese patients with a dense layer of fat tissue under the skin, in patients with narrow intercostal space, in cases with cardiac congestion and impossible in those with ascites. The equipment is not available in every hospital and clinic.
Among all these techniques, the measurement of elasticity and velocity of different tissues by MRI technique as magnetic resonance elastography (MRE) seems to become more promising for the exact diagnosis and grade of fibrosis in any organ such as the liver compared to TE.10,11 TE indicates the grade of fibrosis in a small area of liver near the surface, while MRE quantifies the tissue elasticity over the whole organ, not suffering from sampling or interpretation variability of the histological diagnosis.
All these imaging techniques mentioned above and their modalities are time consuming, complicated, cost-intensive and most importantly not available in all cities and hospitals for patients. The aim of our study is to determine the reliability and the importance of various parameters of abdominal sonography as a readily available, cost-effective, repeatable, bedside-feasible method combined with biochemical markers compared with the histological findings for the diagnosis of various grades of fibrosis and cirrhosis.
Materials and Methods
All patients with chronic parenchymal diseases due to hepatitis B virus (HBV) or hepatitis C virus (HCV) infection, auto-immune etiology or increased serum enzyme of unknown origin were included. Patients with liver malignancy, biliary diseases, liver congestion or ascites were excluded. Because of religious reasons in Iran, none of our patients had a history of alcohol abuse.
Liver biopsy was taken by Tru-Cut needle through the right intercostal space. The needle gauge 16 was used, which could provide a 20 mm length of liver tissue and at least seven portal spaces. The time interval between the liver biopsy and the abdominal sonography was about one month. The liver histology was reviewed by an experienced pathologist in this field. Liver fibrosis was classified into six distinct stages, stage 1 to stage 6 on the basis of disease severity according to the Knodell scoring system.12 We further categorized liver fibrosis into minimal to moderate (stage 1–3) and advanced fibrosis and cirrhosis (stage 4–6). All sonographic and biochemical variables were dichotomized into two groups, zero and one.
Abdominal sonography was conducted (Aloka instrument Hitachi, Model SSD-620, 3.5 MHZ convex transducer) by an experienced gastroenterologist who had no knowledge of liver biopsy results. Multiple sonographic variables were used for the assessment of the liver structures. They include: 1) Right and left lobe nodularity (smooth and indefinite = 0.00, micro- or macro-nodular = 1); 2) Right and left lobe edge biconvexity (without biconvexity = 0.00 and with biconvexity = 1); 3) Right and left interrupted surface line (continuous surface line = 0.00, and interrupted surface line = 1); 4) Angle of left lobe (≤ 45 degrees = 0.00, and > 45 degrees = 1); 5) Anterior-posterior diameter of caudate lobe (≤ 2.5 centimeter = 0.00 and > 2.5 cm = 1); 6) Liver echogenicity in comparison to echogenicity of renal cortex texture (normal and moderately increased = 0.00, and markedly increased = 1); 7) Echotexture (homogenous = 0.00, Indefinite, coarse and very coarse = 1); 8) Spleen size (≤ 11 cm = 0.00 and > 11 cm = 1).
Laboratory tests were also included in this study: aspartate platelet ratio index (APRI) as aspartate transaminase to platelet ratio index according to Wai et al13 (≤1 = 0.00, and >1 = 1), serum albumin level (≥ 3.5 g % = 0.00 and < 3.5 g % = 1), international normalized ratio (INR) (≤ 1.4 = 0.00, and >1.4 = 1).
Statistical Method
SPSS (version 20, SPSS, Inc, IL, USA) and STATA (version 12.0, Stata Corp., College Station, TX, USA) were used for statistical analyses. Results were presented as mean (standard deviation; SD) or median (with first quartile = q1 and third quartile = q3) for skewed distribution of continuous variables, as appropriate and frequency for categorical variables. We constructed receiver operating characteristic (ROC) curves to evaluate the accuracy of different scores to distinguish between mild and moderate versus severe fibrosis and cirrhosis and the areas under multiple ROC curves were checked statistically to select the best one. A P < 0.05 was considered significant.
Results
During a period of two years, 197 consecutive patients were enrolled in the study. Most of them were referred by colleagues of our clinic for evaluation of liver diseases. Those with jaundice had no sign of biliary obstruction which was verified by ultrasound. Thirty-nine cases had severe fibrosis and cirrhosis and 158 cases had mild to moderate fibrosis. Those cases with very high liver enzymes and high bilirubin had auto-immune hepatitis. The clinical and laboratory data are shown in Table 1. In order to assess the power of each individual dichotomized variable to differentiate between the two categories of liver fibrosis (stages 1–3 as minimal to moderate and stages 4–6 as advanced fibrosis and cirrhosis), cross tab analysis was used. Sensitivity, specificity, and positive and negative predictive values were calculated. Details are shown in Table 2.
Table 1.
Clinical and Laboratory Data of 197 Subjects (Mean, SD, Median, First and Third Quartile)
|
Variables
|
|
| Gender, No. (%) |
|
| Male |
129 (65.5%) |
| Female |
68 (34.5%) |
| Etiology, No. (%) |
|
| HBV |
148 (75.1%) |
| HCV |
16 (8.1%) |
| Auto–immune hepatitis |
33 (16.8%) |
| Age (years), Mean ± SD |
40.7 ± 13.7 |
| ALT (IU/L), Median (q1-q3) |
34 (22–72) |
| AST (IU/L), Median (q1-q3) |
31 (22-57) |
| Albumin (g/percent), Mean ± SD |
4.3 ± 0.57 |
| INR (international ratio), Mean ± SD |
1.08 ± 0.17 |
| Platelet count (number/cubic mm), Mean ± SD |
198142 ± 64520 |
| Total bilirubin (mg/percent), Median (q1-q3) |
0.9 (0.7–1.4) |
| APRI (aspartate–platelet ratio index), Median (q1-q3) |
0.53 (0.36–1.12) |
Four different scores were made from the combination of more favorably selected dichotomized biochemical and sonographic variables derived from Table 2. Score 1 (sonographic findings only) is a summation score of sonographic variables which were calculated as follows: right lobe nodularity was dichotomized as either smooth or indefinite (zero) or micro nodular and macro nodular (one). Left lobe nodularity was dichotomized as either smooth or indefinite (zero) or micro nodular and macro nodular (one). Angle of left lobe was dichotomized as either less than 45 degrees (zero) or above 45 degrees (one). Liver echotexture was dichotomized as either homogenous (zero) or indefinite, coarse and very coarse (one). Spleen size was either below 11 cm (zero) or above 11 cm (one).
Table 2.
Examining the Power of Different Variables (Sonography and Laboratory) to Distinguish between Mild and Moderate vs. Severe Fibrosis and Cirrhosis by Cross Tab Analysis
|
Variable
|
Sensitivity
Percent (95% CI)
|
Specificity
(Percent)
(95% CI)
|
PPV
(Percent)
(95% CI)
|
NPV
(Percent)
(95% CI)
|
| Right lobe nodularity |
|
|
|
|
Smooth and indefinite = 0.00
Micronodular and macronodular =1 |
28 (15–45) |
98 (95–100) |
78 (52–87) |
85 (82–87) |
| Left lobe nodularity |
|
|
|
|
Smooth and indefinite = 0.00
Micronodular and macronodular =1 |
20 (9–36) |
97 (94–99) |
67 (34–86) |
83 (81–88) |
| Angle of left lobe |
|
|
|
|
Angle < 45 degree = 0.00
Angle > 45 degree = 1 |
67 (50–81) |
58 (49–65) |
28 (23–34) |
88 (81–92) |
| Right lobe edge biconvexity |
|
|
|
|
Not biconvex = 0.00
Biconvex = 1 |
38 (23–55) |
82 (75–88) |
34 (24–46) |
84 (81–87) |
| Left lobe edge biconvexity |
|
|
|
|
Not biconvex = 0.00
Biconvex = 1 |
28 (15–45) |
92 (87–96) |
48 (30–66) |
84 (81–86) |
| Right lobe interrupted surface line |
|
|
|
|
Dotted line present=1
Dotted line absent=0.00 |
43 (28–60) |
89 (88–93) |
50 (36–64) |
86 (82–89) |
| Left lobe interrupted surface line |
|
|
|
|
Dotted line present = 1
Dotted line absent = 0.00 |
33 (19–50) |
90 (84–94) |
45 (30–61) |
84 (81–87) |
| Ap diameter of caudate lobe |
|
|
|
|
Up to 2.5 cm = 0.00
Above 2.5 cm = 1 |
16 (6–31) |
84 (77–89) |
19 (10–35) |
80 (78–83) |
| Echogenicity |
|
|
|
|
Normal, moderately increased = 0.00
Markedly increased = 1 |
28 (15–45) |
85 (79–90) |
32 (20–47) |
83 (80–85) |
| Echotexture |
|
|
|
|
Homogenous = 0.00
Indefinite, coarse and very coarse = 1 |
74 (58–87) |
78 (71–84) |
45 (37–54) |
92(88–95) |
| Spleen size |
|
|
|
|
Up to 11 cm = 0.00
Above 11 cm = 1 |
82 (66–92) |
62 (53–69) |
35 (29–41) |
93 (87–96) |
| APRI |
|
|
|
|
APRI up to 1 = 0.00
APRI above 1 = 1 |
79 (64–91) |
84 (78–89) |
55 (46–65) |
94 (90–97) |
| Serum Albumin |
|
|
|
|
Albumin up to 3.5 gm/dL = 0.00
Albumin above 3.5 gm/dL = 1 |
28 (15–45) |
95 (90–98) |
58 (37–76) |
84 (81–87) |
| INR |
|
|
|
|
INR up to 1.4 = 0.00
INR above 1.4 = 1 |
20 (9–36) |
98 (95–100) |
73 (43–91) |
83 (81–85) |
| Total bilirubin |
|
|
|
|
Total bilirubin up to 1.4 mg/dL = 0.00
Total bilirubin above 1.4 mg/dL = 1 |
33 (19–50) |
81 (75–87) |
30 (20–44) |
83 (80–86) |
Score 2 (laboratory data only) is a summation score of serum albumin level, INR and APRI which was calculated as follows: Serum albumin level was dichotomized as either above 3.5 gm% (zero) or below 3.5 gm% (one). INR was dichotomized as either below 1.4 (zero) or above 1.4 (one). APRI was dichotomized as either below one (zero) or above one (one). Score 3 contained only the score for APRI. Score 4 is the summation of all the scores1 and 2.
ROC curve analysis was used to calculate the sensitivity and specificity of each score to distinguish between two liver fibrosis categories. The scores were used as a test variable and categorized liver fibrosis as state variable in the ROC curve analysis. Areas under curves were 85% (95% CI = 78–92%) for sonographic variables, 83.8% (95% CI = 77–91%) for laboratory variables, 81.8 % (95% CI = 75–89%) for APRI only, and 92.4% (95% CI = 88–96%) for sonographic and laboratory variables together. Details are shown in Figure 1. Sensitivities were 85%, 82%, 79% and 87% for scores 1, 2, 3 and 4, respectively. Specificities were 73%, 82%, 84% and 88% for scores 1, 2 3 and 4, respectively. In addition, there was significant statistical difference in diagnostic value between score 1, 2 and 4 (P < 0.001).
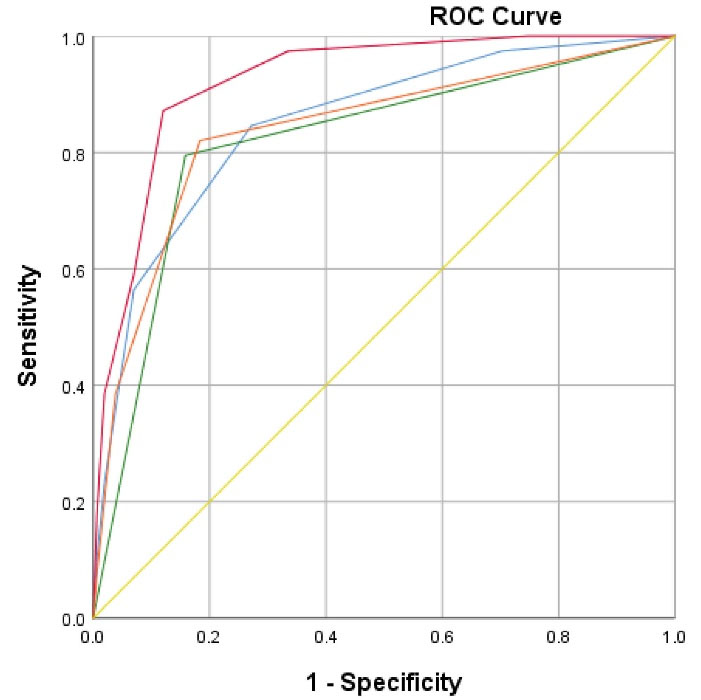
Figure 1.
Areas Under the Curves: 1) Blue color (score 1): Area under the curve with 85% (95% CI = 78–92%) includes sonographic findings only: Nodularity (right + left lobes), Angle of left lobe, liver echotexture and spleen size. Orange color (score 2): Area under the curve with 83.8% (95% CI = 77–91%) includes laboratory findings only (serum albumin level, INR and APRI). Green color (score 3): Area under the curve with 81.8% (95% CI = 75–89%) includes APRI (aspartate platelet ratio index) only. Red color (score 4): Area under the curve with 92% (95% CI = 88–96) includes scores 1 and 2.
.
Areas Under the Curves: 1) Blue color (score 1): Area under the curve with 85% (95% CI = 78–92%) includes sonographic findings only: Nodularity (right + left lobes), Angle of left lobe, liver echotexture and spleen size. Orange color (score 2): Area under the curve with 83.8% (95% CI = 77–91%) includes laboratory findings only (serum albumin level, INR and APRI). Green color (score 3): Area under the curve with 81.8% (95% CI = 75–89%) includes APRI (aspartate platelet ratio index) only. Red color (score 4): Area under the curve with 92% (95% CI = 88–96) includes scores 1 and 2.
Areas of ROC curves of different scores were compared. Areas under ROC curves of score 4 were significantly different to the other scores (1, 2, and 3). P values were 0.003, 0.005, and 0.001, respectively. Areas under the ROC curves of score 1 to score 2, score 1 to score 3, and score 2 to score 3 were compared. The differences were all non-significant. P values were 0.80, 0.51 and 0.24, respectively.
Discussion
Among the various ultrasound variables, in line with the findings of many other researchers, the nodularity was the most important diagnostic indicator of liver cirrhosis.14-19 In addition to this indicator, with inclusion of further variables namely angle of left lobe, echotexture of the liver and, spleen size, an excellent diagnostic accuracy of 85% was achieved in our study. Simonovský only focused on uneven liver surface and found by examination with the 7.5 MHZ transducer for the diagnosis of cirrhosis a sensitivity of 91.1% and a specificity of 93.5% based on histological findings.20 Nishiura et al examined three ultrasound parameters in 103 patients with chronic liver diseases: liver surface irregularity, bluntness of liver edge and parenchyma coarseness with two probes (2–5 and 5–12 MHZ frequency). The accuracy of ultrasound score was 100% for correctly predicting cirrhosis.21 Among these three ultrasound parameters, the correlation between liver surface irregularity and the histological severity of fibrosis was the best (90%). Colli et al found the liver surface nodularity alone to be the most reliable factor for the diagnosis of cirrhosis with an accuracy of 86%. By including hypertrophy of caudate lobe and slow velocity of portal vein, the reliability of the diagnosis increased by only 2% to 88%.22 Aubé et al studied 11 factors of ultrasound examination and found that liver surface has a diagnostic accuracy of 68% for cirrhosis of different etiologies, which performed the best for viral etiologies with 84%.23
Nagata et alcompared the laparoscopic appearance of the surface of 77 patients with chronic liver diseases with US examination and observed the diffusely irregular or nodular patterns with US examination only in 68% of patients with liver cirrhosis.24 A modest correlation was found between US diagnosis of cirrhosis and histology in a study with 69 patients only.25 Even so, Shen et al found a modest relationship between liver surface irregularity as well as parenchyma echotexture and histology.26 However, in this study, only a few of their 324 patients (9.3%) had histologically advanced fibrosis and two persons performed the US examination. In contrast to all other studies, Choong et al did not find a good correlation between US and histology in a retrospective study.27
There are few examinations of the diagnostic potential of modern imaging systems in comparison to abdominal US for evaluation of advanced liver fibrosis. Kudo et al examined 124 patients with chronic liver diseases and hepatocellular carcinoma, who underwent surgery. The ROC curve for the distinction of liver cirrhosis from non-cirrhotic cases by CT, MRI and abdominal ultrasound study was compared to histology.28 They evaluated the irregular or nodular surface, blunt edge, parenchymal abnormalities, and morphological changes of the liver and portal hypertension as imaging parameters by using all three comparative methods. The accuracy was slightly better for CT and MRI than ultrasound, but the difference was not significant. In another study by Hung et al29 on 210 patients, 67 with HBV and 141 with HCV infection, cirrhosis could be predicted well by ultrasound score consisting of liver surface, parenchyma echotexture, spleen size and vascular structure compared histologically with fibrosis score. The accuracy of cirrhosis diagnosis was better in HBV infected patients (88.6%) than HCV infected patients (74.8%).
TE was compared with ultrasound examination in 189 patients in a liver clinic. The parameters for ultrasound evaluation were liver surface irregularities, liver edge and liver echotexture. ROC curves for prediction of liver cirrhosis by TE > 15 were 0.86 for liver surface irregularity, 0.77 for liver edge, 0.83 for liver echotexture and 0.90 for the total US score. The authors concluded that US score can be used as a substitute for TE.30
Among the laboratory tests in our study, the ROC curve of the APRI test alone (the ratio of aspartate transaminase to platelet),first described by Wai et al13 was good enough (81.8%) for diagnosis of advanced fibrosis and cirrhosis. However, with the addition of two further laboratory variables, INR and albumin concentration, the ROC curve analysis did not achieve a much higher value (83.5%). The combination of ultrasound examination with all laboratory tests had an excellent accuracy of 92.4%.
The simple abdominal ultrasound examination in small, portable, compact form is now becoming like a stethoscope: a simple, accessible tool in routine bedside clinical examination enabling immediate imaging of all organs with rapid diagnosis and procedural management as imaging method of choice. This is in contrast to all other imaging modalities such as MRI and CT or TE, which are all not easily accessible and very expensive.31 The limitations of US are only its operator dependency and the long training required for the exact evaluation of the structure of organs.
Ultrasound training is now included in the medical curriculum in some countries.32 Its general application by any practitioner and specialist in all medical fields would contribute to immediate and safe diagnosis as well as management with enormous reductions in health costs.
Acknowledgements
We are indebted to Mrs. Sahar Masoudi for her help with statistical analysis.
Authors’ Contribution
GM performed liver puncture. NR collected all data. MS evaluated histologically all liver biopsies and SM performed by all subjects the abdominal ultrasound.
Conflict of Interest Disclosures
The authors declare that they have no conflict of interest.
Ethical Statement
The study was approved by the human medical research committee and registered under NIMAD.REC.1396.062.
References
- Chen Y, Wang BE, Jia JD, Qian LX, Wang TL, Chen MH. [Noninvasive evaluation of liver fibrosis in chronic hepatitis B patients]. Zhonghua Gan Zang Bing Za Zhi 2003; 11(6):354-7. [ Google Scholar]
- Venkatesh SK, Yin M, Takahashi N, Glockner JF, Talwalkar JA, Ehman RL. Non-invasive detection of liver fibrosis: MR imaging features vs. MR elastography. Abdom Imaging 2015; 40(4):766-75. doi: 10.1007/s00261-015-0347-6 [Crossref] [ Google Scholar]
- Lu LG, Zeng MD, Wan MB, Li CZ, Mao YM, Li JQ. Grading and staging of hepatic fibrosis, and its relationship with noninvasive diagnostic parameters. World J Gastroenterol 2003; 9(11):2574-8. doi: 10.3748/wjg.v9.i11.2574 [Crossref] [ Google Scholar]
- Lo GC, Besa C, King MJ, Kang M, Stueck A, Thung S. Feasibility and reproducibility of liver surface nodularity quantification for the assessment of liver cirrhosis using CT and MRI. Eur J Radiol Open 2017; 4:95-100. doi: 10.1016/j.ejro.2017.07.001 [Crossref] [ Google Scholar]
- Sandrin L, Fourquet B, Hasquenoph JM, Yon S, Fournier C, Mal F. Transient elastography: a new noninvasive method for assessment of hepatic fibrosis. Ultrasound Med Biol 2003; 29(12):1705-13. doi: 10.1016/j.ultrasmedbio.2003.07.001 [Crossref] [ Google Scholar]
- Castéra L, Vergniol J, Foucher J, Le Bail B, Chanteloup E, Haaser M. Prospective comparison of transient elastography, fibrotest, APRI, and liver biopsy for the assessment of fibrosis in chronic hepatitis C. Gastroenterology 2005; 128(2):343-50. doi: 10.1053/j.gastro.2004.11.018 [Crossref] [ Google Scholar]
- Branchi F, Conti CB, Baccarin A, Lampertico P, Conte D, Fraquelli M. Non-invasive assessment of liver fibrosis in chronic hepatitis B. World J Gastroenterol 2014; 20(40):14568-80. doi: 10.3748/wjg.v20.i40.14568 [Crossref] [ Google Scholar]
- Ragazzo TG, Paranagua-Vezozzo D, Lima FR, de Campos Mazo DF, Pessoa MG, Oliveira CP. Accuracy of transient elastography-FibroScan®, acoustic radiation force impulse (ARFI) imaging, the enhanced liver fibrosis (ELF) test, APRI, and the FIB-4 index compared with liver biopsy in patients with chronic hepatitis C. Clinics (Sao Paulo) 2017; 72(9):516-25. doi: 10.6061/clinics/2017(09)01 [Crossref] [ Google Scholar]
- Karanjia RN, Crossey MM, Cox IJ, Fye HK, Njie R, Goldin RD. Hepatic steatosis and fibrosis: non-invasive assessment. World J Gastroenterol 2016; 22(45):9880-97. doi: 10.3748/wjg.v22.i45.9880 [Crossref] [ Google Scholar]
- Muthupillai R, Lomas DJ, Rossman PJ, Greenleaf JF, Manduca A, Ehman RL. Magnetic resonance elastography by direct visualization of propagating acoustic strain waves. Science 1995; 269(5232):1854-7. doi: 10.1126/science.7569924 [Crossref] [ Google Scholar]
- Bensamoun SF, Wang L, Robert L, Charleux F, Latrive JP, Ho Ba Tho MC. Measurement of liver stiffness with two imaging techniques: magnetic resonance elastography and ultrasound elastometry. J Magn Reson Imaging 2008; 28(5):1287-92. doi: 10.1002/jmri.21523 [Crossref] [ Google Scholar]
- Desmet VJ. Knodell RG, Ishak KG, Black WC, Chen TS, Craig R, Kaplowitz N, Kiernan TW, Wollman J. Formulation and application of a numerical scoring system for assessing histological activity in asymptomatic chronic active hepatitis [Hepatology 1981;1:431-435]. J Hepatol 2003; 38(4):382-6. doi: 10.1016/s0168-8278(03)00005-9 [Crossref] [ Google Scholar]
- Wai CT, Greenson JK, Fontana RJ, Kalbfleisch JD, Marrero JA, Conjeevaram HS. A simple noninvasive index can predict both significant fibrosis and cirrhosis in patients with chronic hepatitis C. Hepatology 2003; 38(2):518-26. doi: 10.1053/jhep.2003.50346 [Crossref] [ Google Scholar]
- Di Lelio A, Cestari C, Lomazzi A, Beretta L. Cirrhosis: diagnosis with sonographic study of the liver surface. Radiology 1989; 172(2):389-92. doi: 10.1148/radiology.172.2.2526349 [Crossref] [ Google Scholar]
- Ferral H, Male R, Cardiel M, Munoz L, Quiroz y Ferrari F. Cirrhosis: diagnosis by liver surface analysis with high-frequency ultrasound. Gastrointest Radiol 1992; 17(1):74-8. doi: 10.1007/bf01888512 [Crossref] [ Google Scholar]
- Ladenheim JA, Luba DG, Yao F, Gregory PB, Jeffrey RB, Garcia G. Limitations of liver surface US in the diagnosis of cirrhosis. Radiology 1992; 185(1):21-3. doi: 10.1148/radiology.185.1.1523310 [Crossref] [ Google Scholar]
- Richard P, Bonniaud P, Barthélémy C, Etaix JP, Veyret C, Audigier JC. [Value of ultrasonography in the diagnosis of cirrhoses. Prospective study of 128 patients]. J Radiol 1985; 66(8-9):503-6. [ Google Scholar]
- Goyal AK, Pokharna DS, Sharma SK. Ultrasonic diagnosis of cirrhosis: reference to quantitative measurements of hepatic dimensions. Gastrointest Radiol 1990; 15(1):32-4. doi: 10.1007/bf01888729 [Crossref] [ Google Scholar]
- Gaiani S, Gramantieri L, Venturoli N, Piscaglia F, Siringo S, D’Errico A. What is the criterion for differentiating chronic hepatitis from compensated cirrhosis? a prospective study comparing ultrasonography and percutaneous liver biopsy. J Hepatol 1997; 27(6):979-85. doi: 10.1016/s0168-8278(97)80140-7 [Crossref] [ Google Scholar]
- Simonovský V. The diagnosis of cirrhosis by high resolution ultrasound of the liver surface. Br J Radiol 1999; 72(853):29-34. doi: 10.1259/bjr.72.853.10341686 [Crossref] [ Google Scholar]
- Nishiura T, Watanabe H, Ito M, Matsuoka Y, Yano K, Daikoku M. Ultrasound evaluation of the fibrosis stage in chronic liver disease by the simultaneous use of low and high frequency probes. Br J Radiol 2005; 78(927):189-97. doi: 10.1259/bjr/75208448 [Crossref] [ Google Scholar]
- Colli A, Fraquelli M, Andreoletti M, Marino B, Zuccoli E, Conte D. Severe liver fibrosis or cirrhosis: accuracy of US for detection--analysis of 300 cases. Radiology 2003; 227(1):89-94. doi: 10.1148/radiol.2272020193 [Crossref] [ Google Scholar]
- Aubé C, Oberti F, Korali N, Namour MA, Loisel D, Tanguy JY. Ultrasonographic diagnosis of hepatic fibrosis or cirrhosis. J Hepatol 1999; 30(3):472-8. doi: 10.1016/s0168-8278(99)80107-x [Crossref] [ Google Scholar]
- Nagata N, Miyachi H, Nakano A, Nanri K, Kobayashi H, Matsuzaki S. Sonographic evaluation of the anterior liver surface in chronic liver diseases using a 7.5-MHz annular-array transducer: correlation with laparoscopic and histopathologic findings. J Clin Ultrasound 2003; 31(8):393-400. doi: 10.1002/jcu.10195 [Crossref] [ Google Scholar]
- Kelly EMM, Feldstein VA, Parks M, Hudock R, Etheridge D, Peters MG. An assessment of the clinical accuracy of ultrasound in diagnosing cirrhosis in the absence of portal hypertension. Gastroenterol Hepatol (N Y) 2018; 14(6):367-73. [ Google Scholar]
- Shen L, Li JQ, Zeng MD, Lu LG, Fan ST, Bao H. Correlation between ultrasonographic and pathologic diagnosis of liver fibrosis due to chronic virus hepatitis. World J Gastroenterol 2006; 12(8):1292-5. doi: 10.3748/wjg.v12.i8.1292 [Crossref] [ Google Scholar]
- Choong CC, Venkatesh SK, Siew EP. Accuracy of routine clinical ultrasound for staging of liver fibrosis. J Clin Imaging Sci 2012; 2:58. doi: 10.4103/2156-7514.101000 [Crossref] [ Google Scholar]
- Kudo M, Zheng RQ, Kim SR, Okabe Y, Osaki Y, Iijima H. Diagnostic accuracy of imaging for liver cirrhosis compared to histologically proven liver cirrhosis. A multicenter collaborative study. Intervirology 2008; 51 Suppl 1:17-26. doi: 10.1159/000122595 [Crossref] [ Google Scholar]
- Hung CH, Lu SN, Wang JH, Lee CM, Chen TM, Tung HD. Correlation between ultrasonographic and pathologic diagnoses of hepatitis B and C virus-related cirrhosis. J Gastroenterol 2003; 38(2):153-7. doi: 10.1007/s005350300025 [Crossref] [ Google Scholar]
- Endo M, Soroida Y, Sato M, Kobayashi T, Hikita H, Sato M. Ultrasound evaluation of liver stiffness: accuracy of ultrasound imaging for the prediction of liver cirrhosis as evaluated using a liver stiffness measurement. J Med Dent Sci 2017; 64(2-3):27-34. doi: 10.11480/jmds.640301 [Crossref] [ Google Scholar]
- Dietrich CF, Goudie A, Chiorean L, Cui XW, Gilja OH, Dong Y. Point of care ultrasound: a WFUMB position paper. Ultrasound Med Biol 2017; 43(1):49-58. doi: 10.1016/j.ultrasmedbio.2016.06.021 [Crossref] [ Google Scholar]
- Hoppmann RA, Rao VV, Bell F, Poston MB, Howe DB, Riffle S. The evolution of an integrated ultrasound curriculum (iUSC) for medical students: 9-year experience. Crit Ultrasound J 2015; 7(1):18. doi: 10.1186/s13089-015-0035-3 [Crossref] [ Google Scholar]